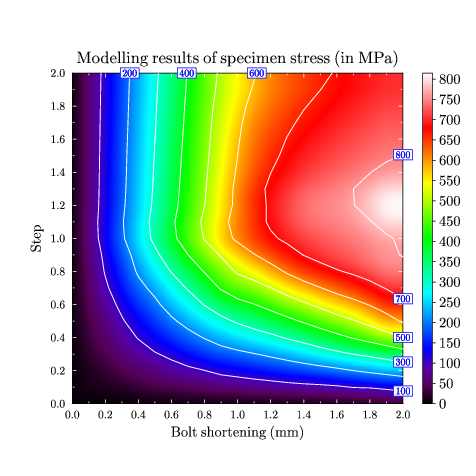
GLE Example: colormapcontour.gle

[PDF file]
! Example of how to use color map and contour at the same time.
! Plot of modelling results coming from Abaqus.
! By Fabien Leonard.

size 12 12

set font texcmr

include "color.gle"
include "contour.gle"

! creates the z-value file to be used by the contour command
begin fitz
   data "Zstress.csv"
   x from 0 to 2 step 0.1
   y from 0 to 2 step 0.1
   ncontour 6
end fitz

begin contour
   data "Zstress.z"
   values from 100 to 800 step 100
end contour

begin graph
   title "Modelling results of specimen stress (in MPa)"
   xtitle "Bolt shortening (mm)"
   ytitle "Step"
   xticks color white
   yticks color white
   colormap "Zstress.z" 500 500 color
   data "Zstress-cdata.dat"
   d1 line color white lwidth 0.02
end graph

amove xg(xgmax)+0.5 yg(ygmin)
color_range_vertical zmin 0 zmax 815 zstep 50 pixels 1500 format "fix 0"
contour_labels file "Zstress-clabels.dat" format "fix 0"
[Return to examples page]
