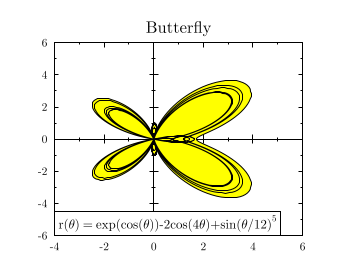
GLE Example: butterfly.gle

[PDF file]
size 9 7

include "graphutil.gle"
include "polarplot.gle"

set font texcmr
begin graph
   math
   title "Butterfly"
   xaxis min -4 max 6 dticks 2
   yaxis min -6 max 6 dticks 2
   labels off
   x0labels on
   y0labels on
   x2axis on
   y2axis on
   draw polar "exp(cos(t))-2*cos(4*t)+sin(t/12)^5" 0 12*pi fill yellow
end graph

set color black hei 0.33 just bl
graph_textbox label "r(\theta) = exp(cos(\theta))-2cos(4\theta)+sin(\theta/12)^5"
[Return to examples page]
