Polar Plots
Two dimensional polar plots of data and functions.
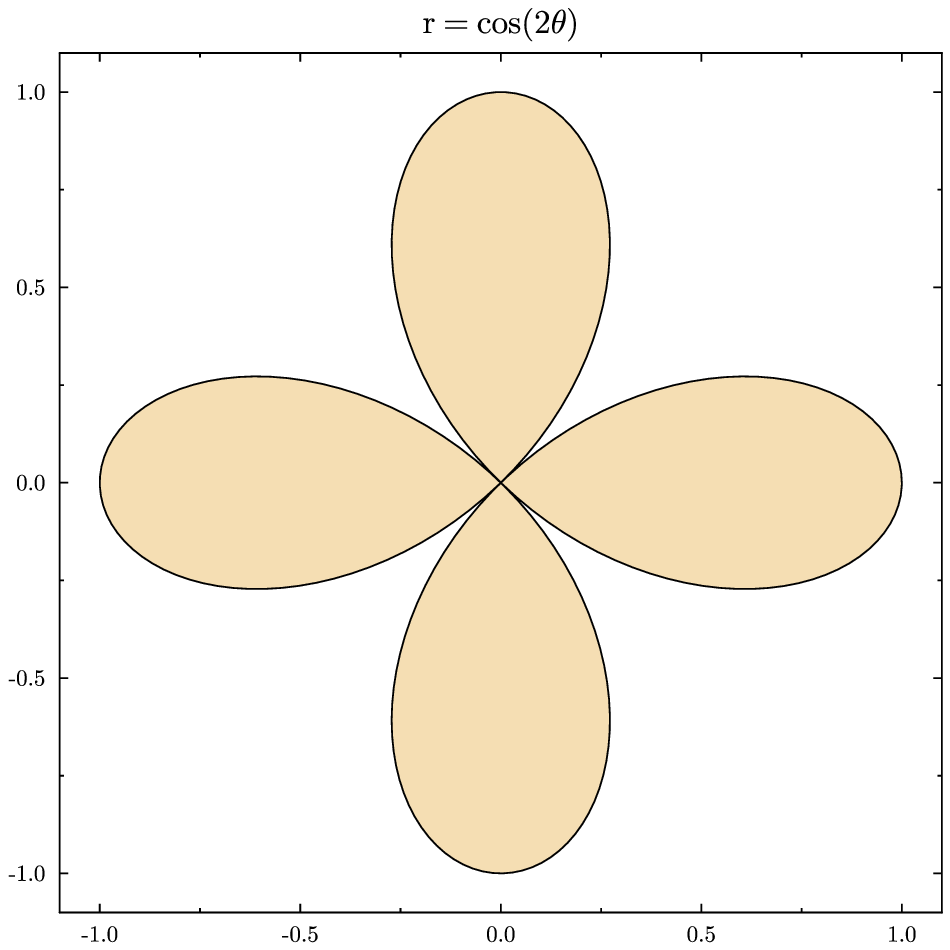
cos2t.gle
cos2t.gle
size 12 12

include "polarplot.gle"

set font texcmr
begin graph
   center
   scale auto
   title "r = cos(2\theta)"
   xaxis min -1.1 max 1.1
   yaxis min -1.1 max 1.1
   draw polar "cos(2*t)" from 0 to 2*pi fill wheat
end graph
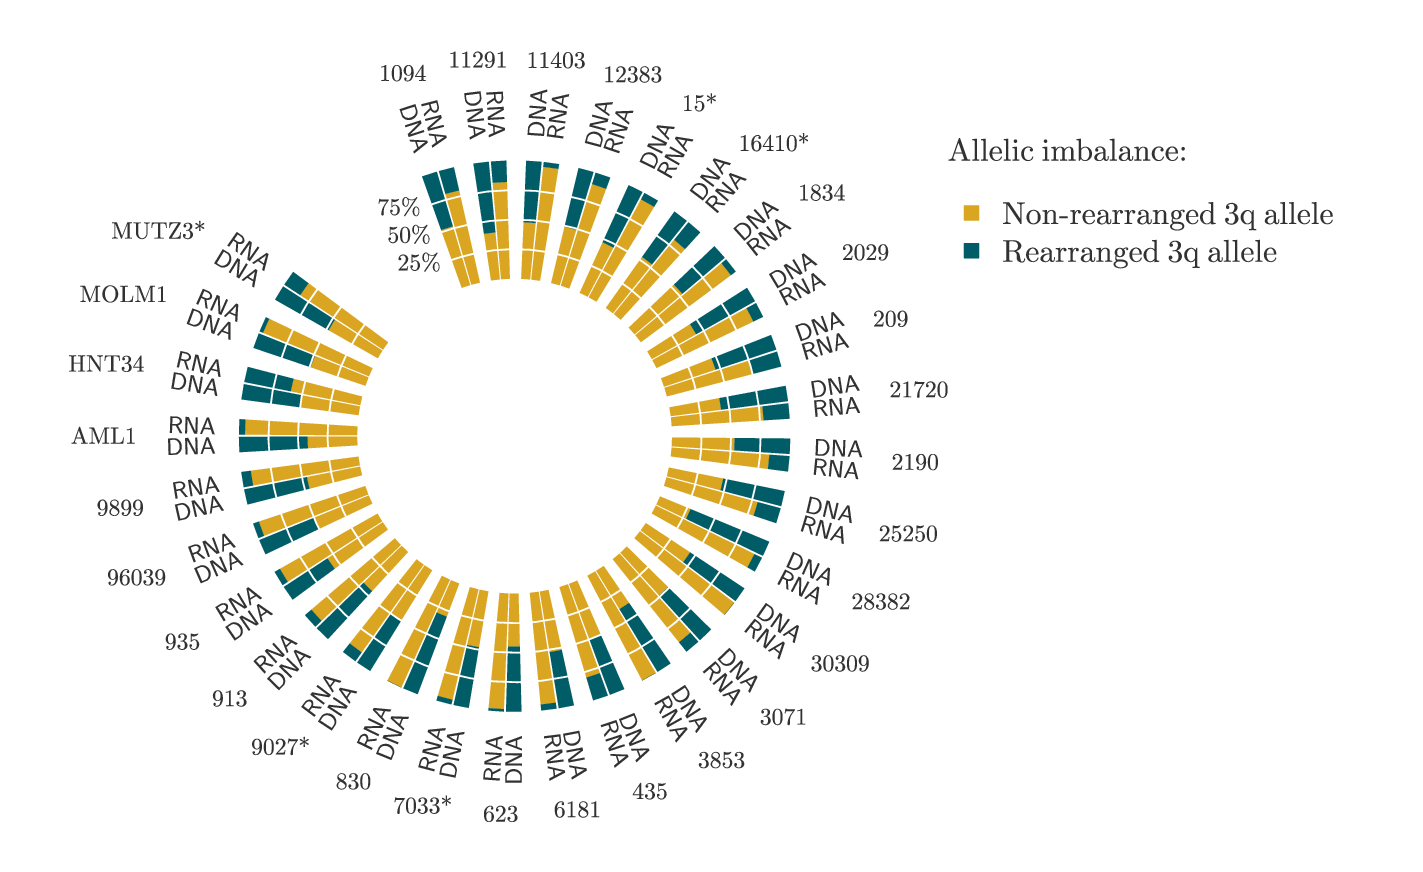
histogram.gle
 histogram.gle histogram.zip zip file contains all files for this figure.
histogram.gle
! Example of circular histogram.
! Author: Francois Tonneau

size 18 11

include pole.gle

set font texcmss hei 0.3

color_1$ = "#daa520"
color_2$ = "#005d67"

wheelcenter 6.5 5.5
wheeldims 2 3.5
wheelvalues 0 100

startangles at 108 going clockwise

drawpolarhist "histogram.dat" width 3.2 direction outward

set color white lwidth 0.02
drawsomerings 25 50 75

set color gray70

labelstyle dist 0.3 just radial
writelabelsfrom "histogram.dat"

set font ss hei 0.3

tagstyle xoffset -0.4 yoffset 0.1 just tc format "fix 0 append %"
writesometags -2 25 50 75

labelstyle dist 1.3 just basic
writelabelsfrom "histlabels.dat"

set hei 0.4
amove 12 9
write "Allelic imbalance:"
begin key
    absolute 12 7.5 nobox dist 0.3
    marker fsquare msize 0.25 color color_1$ text "Non-rearranged 3q allele"
    marker fsquare msize 0.25 color color_2$ text "Rearranged 3q allele"
end key
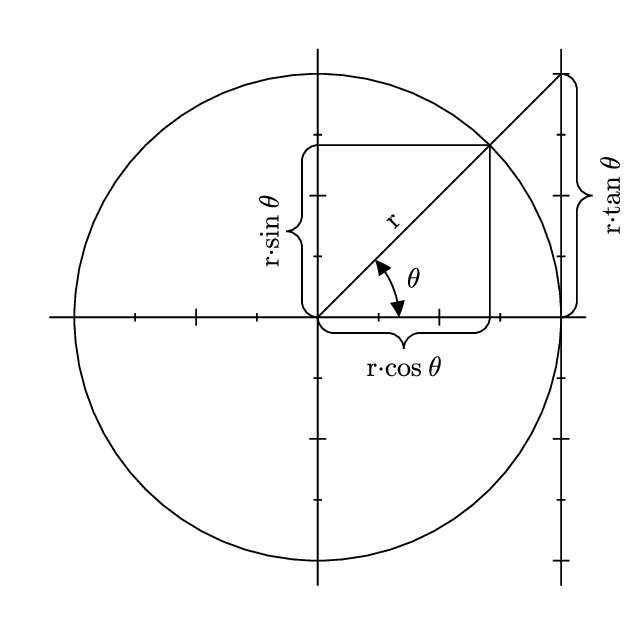
polarcircle.gle
polarcircle.gle
size 8 8

include "shape.gle"

set hei 0.35 arrowangle 25 arrowsize 0.2 font texcmr

begin graph
   scale 0.85 0.85 math
   xaxis min -1.1 max 1.1
   yaxis min -1.1 max 1.1
   y2axis on offset 1 symticks
   xlabels off
   ylabels off
   y2labels off
   xnoticks -1 1
   ynoticks -1 1
   y2noticks 0
end graph

radius = xg(1)-xg(0)

amove xg(0) yg(0)
circle radius

arc radius/3 0 45 arrow both

amove xg(0) yg(0)
xp = xg(cos(torad(45)))
yp = yg(sin(torad(45)))
yt = yg(tan(torad(45)))

aline xg(1) yt
amove xp    yp
aline xg(0) yp
amove xp    yp
aline xp    yg(0)

curly_bracket xp    yg(0) xg(0) yg(0) 0.2
curly_bracket xg(0) yg(0) xg(0) yp    0.2
curly_bracket xg(1) yt    xg(1) yg(0) 0.2

line_label xg(0) yg(0) xp    yp    "r" 0.1
line_label xg(0) yg(0) xp    yg(0) "r\cdot cos \theta" -0.5
line_label xg(0) yg(0) xg(0) yp    "r\cdot sin \theta"  0.5
line_label xg(1) yg(0) xg(1) yt    "r\cdot tan \theta" -0.5

set just cc
amove xg(0.425*cos(torad(45/2))) yg(0.425*sin(torad(45/2)))
write "\theta"
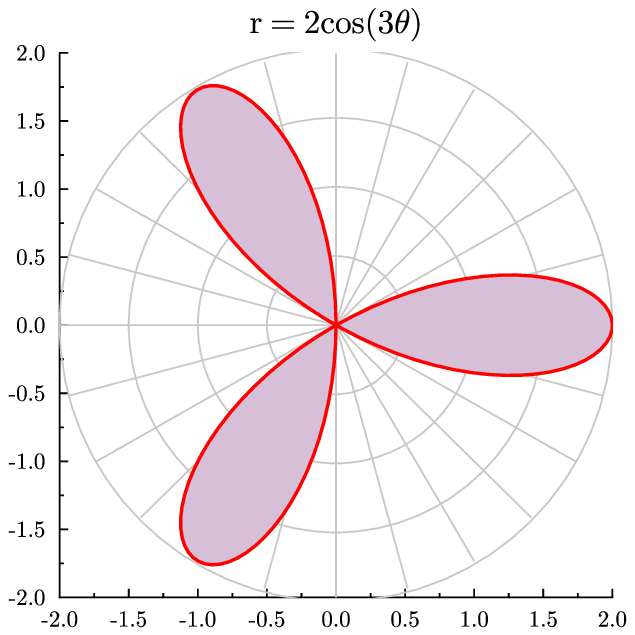
polargrid.gle
polargrid.gle
size 8 8

include "polarplot.gle"

set font texcmr
begin graph
   center
   scale auto
   title "r = 2cos(3\theta)"
   xaxis min -2 max 2
   yaxis min -2 max 2
   x2axis off
   y2axis off
   draw polar_grid radius 2 rings 4 sectors 24
   draw polar "2*cos(3*t)" from 0 to pi color red fill thistle lwidth 0.04
end graph
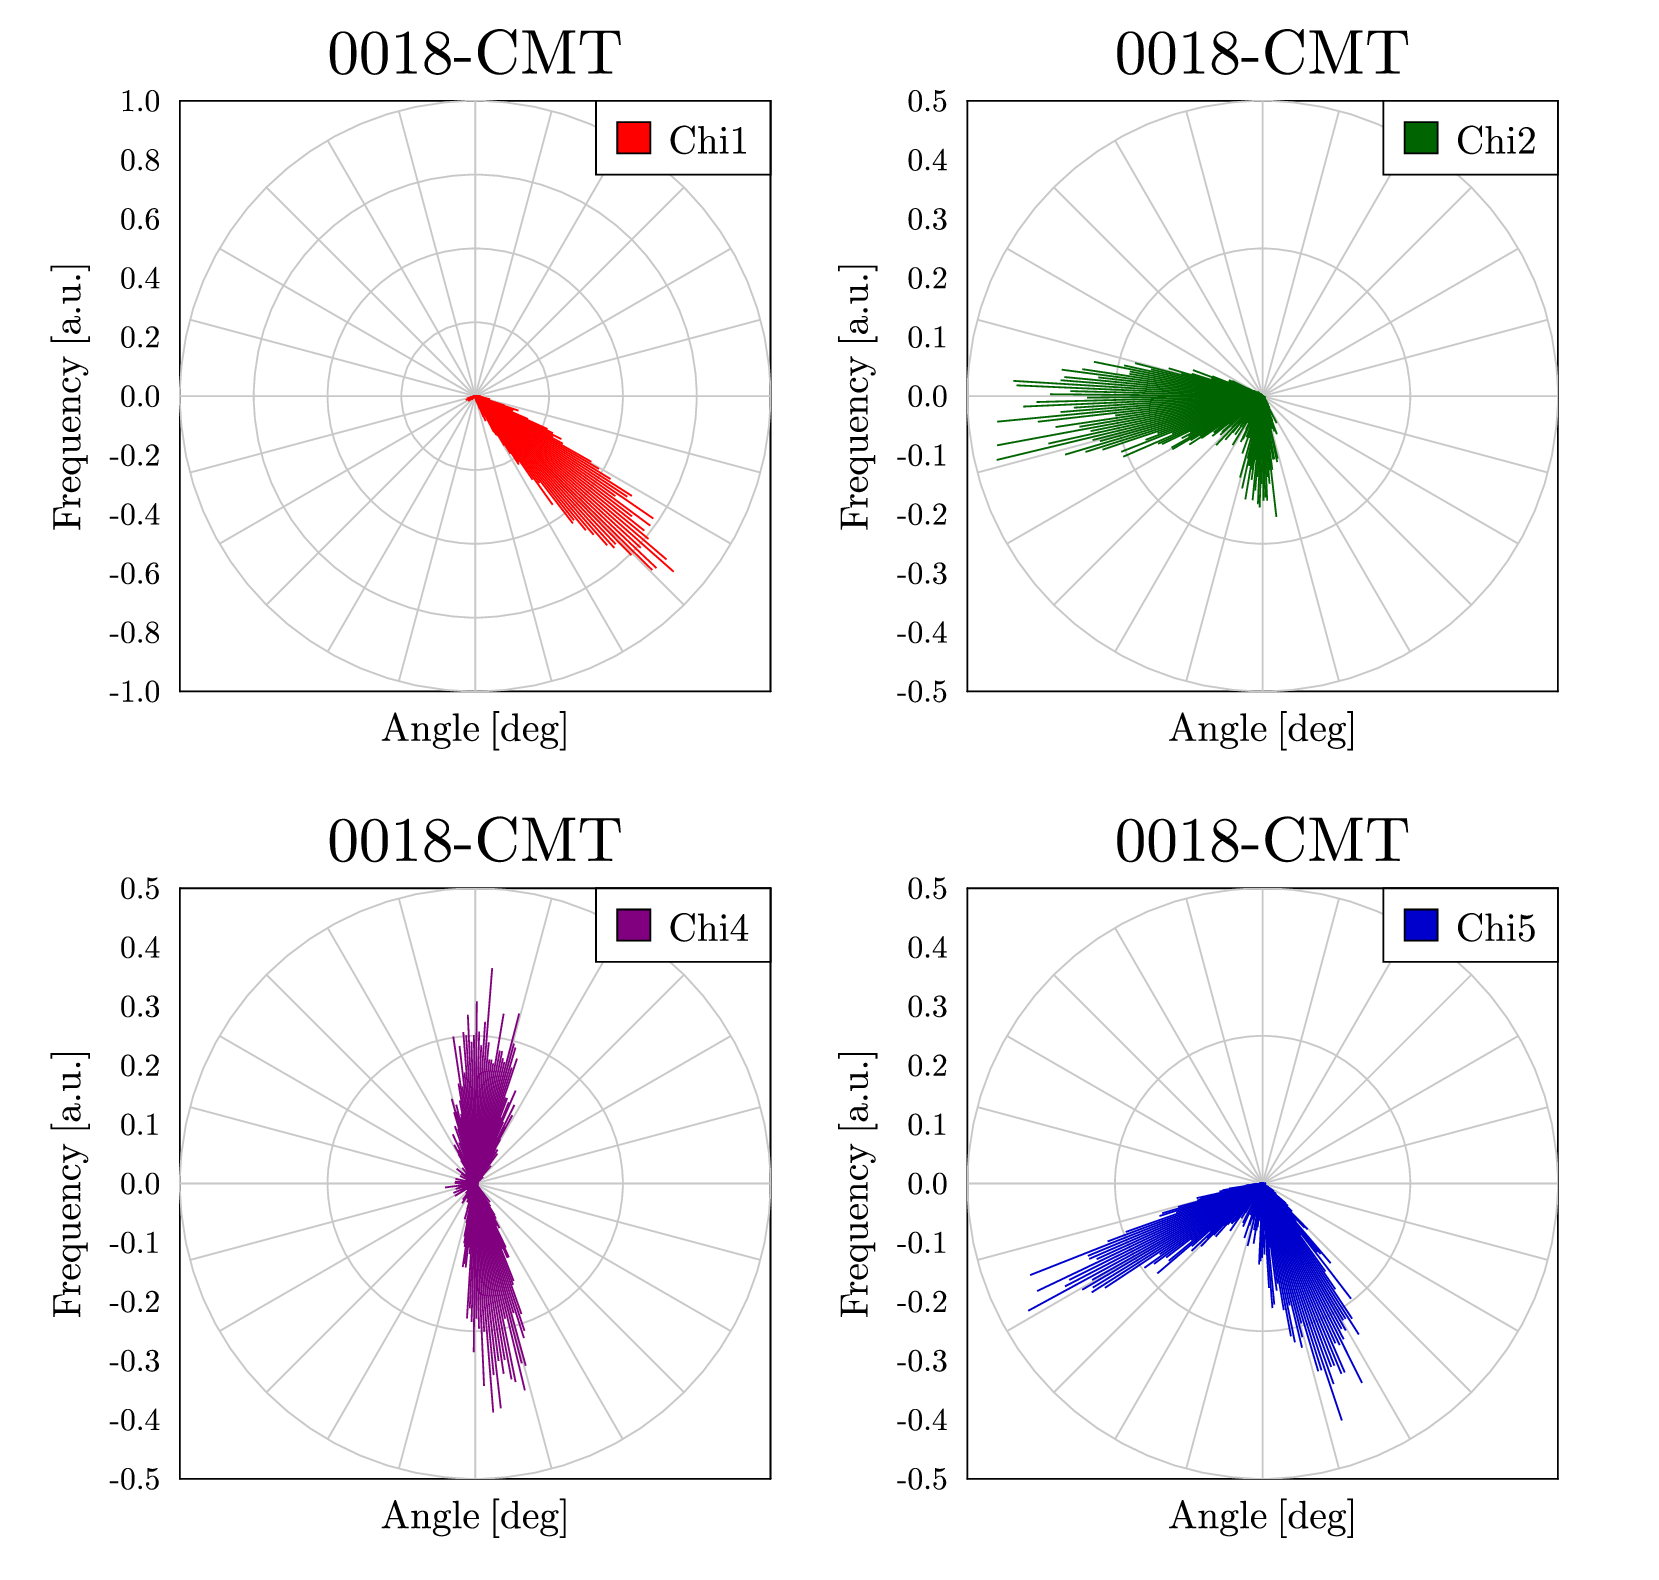
polar_histogram.gle
 polar_histogram.gle polar_histogram.zip zip file contains all files for this figure.
polar_histogram.gle
size 21 20

include "polarplot.gle"

set font texcmr

sub draw_histogram dataset$ series scale color$ key$ title$
  set hei 0.5
  begin graph
     size 10 10
     scale 0.75 0.75
     title title$ hei 0.8
     xaxis min -1/scale max 1/scale
     yaxis min -1/scale max 1/scale
     xtitle "Angle [deg]"
     xlabels off
     ytitle "Frequency [a.u.]"
     xticks off
     yticks off
     data "0018-CMT.hist" d1=c1,c[series]
     draw polar_grid radius 1/scale rings 4/scale sectors 24
     draw polar_data d1 color color$ type line
  end graph
  begin key
    position tr
    fill color$ text key$
  end key
end sub

amove 1 10
draw_histogram dataset$ 4 scale 1 color red key "Chi1" title "0018-CMT"

amove 11 10
draw_histogram dataset$ 5 scale 2 color darkgreen key "Chi2" title "0018-CMT"

amove 1 0
draw_histogram dataset$ 7 scale 2 color purple key "Chi4" title "0018-CMT"

amove 11 0
draw_histogram dataset$ 8 scale 2 color mediumblue key "Chi5" title "0018-CMT"
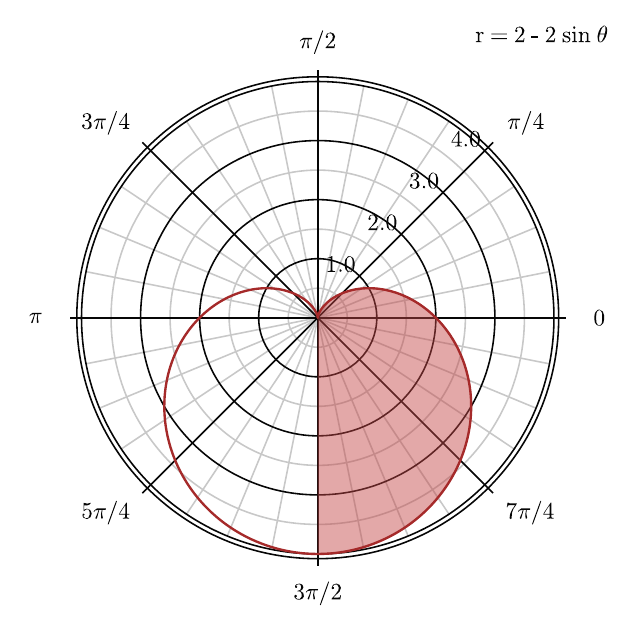
polar_plot.gle
polar_plot.gle
! Example of polar plot.
! Author: Francois Tonneau

! Compile this script with the -cairo option.

! Plot design after: https://texample.net/polar-plot/

size 8 8

include "pole.gle"

set font texcmr hei 0.3

wheelcenter pagewidth()/2 pageheight()/2
wheeldims   0 3
wheelvalues 0 4

set color gray10 join round
drawrays from 0 to 360 by 180/16
drawrings from 0.5 to 3.5

set color gray90

ticklength 0.15
drawrays from 0 to 315
drawticks from 0 to 315
drawsomerings 1 2 3 4 4.08

tagstyle xoffset -0.05 yoffset 0.15 just cr
writetags at 45 from 1 to 4

labelstyle dist 0.5
angleformat "pi"
writeangles from 0 to 2*pi by pi/4 no last

drawpolareq "2 - 2 * sin(t)" from -pi/2 to pi/2 color lightcoral &
    fill rgba255(195, 70, 70, 120)

drawpolareq "2 - 2 * sin(t)" from 0 to 2*pi color brown lwidth 0.03

amove 6 7.5
write "r = 2 - 2 sin \theta"
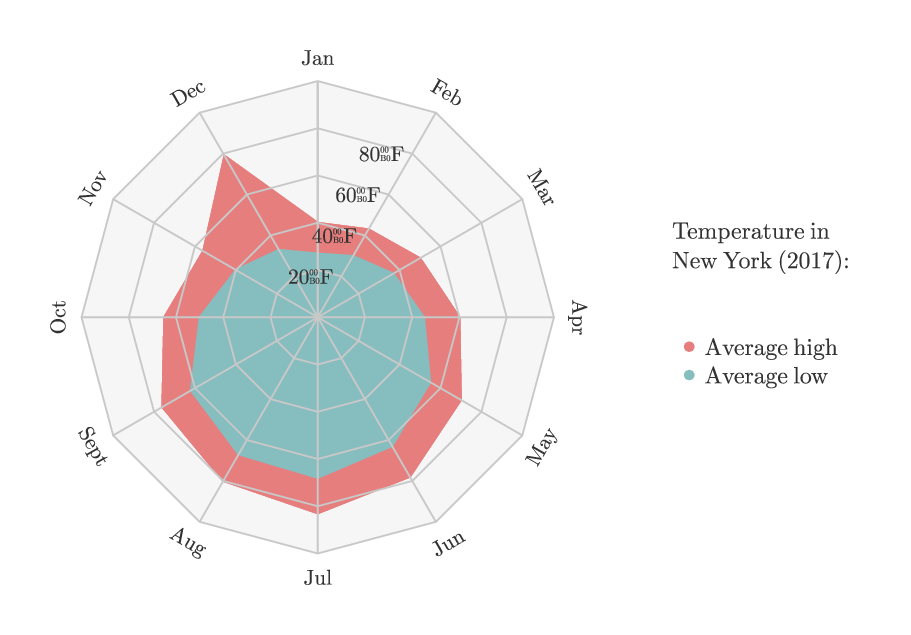
radar.gle
 radar.gle radar.zip zip file contains all files for this figure.
radar.gle
! Example of radar plot.
! Author: Francois Tonneau

size 11.5 8

include pole.gle

set font ss hei 0.3

begin graph
    data "./radar.dat" d1=c2,c4 d2=c2,c5
    axis off
end graph

wheelcenter 4 4
wheeldims 0 3
wheelvalues 0 100
startangles at 90 going clockwise

fillweb fill "#f6f6f6" pin 30

set color gray10
drawthreadaround pin 30

drawpolarline d1 color "#e67e7e" fill "#e67e7e" close end
drawpolarline d2 color "#86bdbf" fill "#86bdbf" close end

set color gray10
drawrays from 0 to 360 by 30
drawthreads from 20 to 80 by 20 pin 30

set color gray70 hei 0.27

labelstyle just circular
writelabelsfrom "./radar.dat"

tagstyle xoffset -0.1 just cr format "fix 0 append °F"
writetags at 30 from 20 to 80 by 20

set hei 0.3
amove 8.5 5
write "Temperature in \lineskip{1.25}\\New York (2017):"
begin key
    absolute 8.5  3 nobox
    marker fcircle color "#e67e7e" msize 0.16 text "Average high"
    marker fcircle color "#86bdbf" msize 0.16 text "Average low"
end key
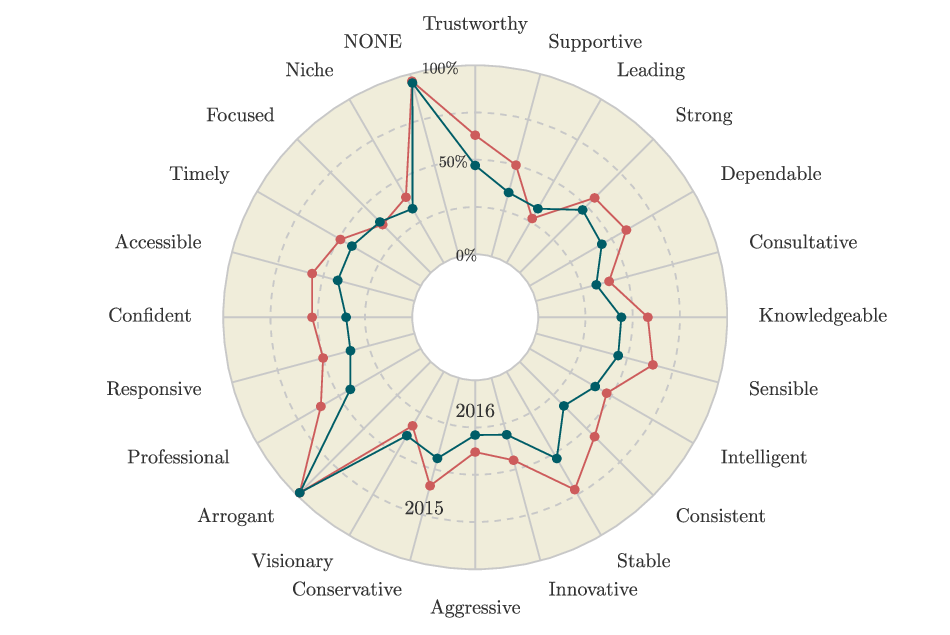
spider.gle
 spider.gle spider.zip zip file contains all files for this figure.
spider.gle
! Example of spider plot.
! Author: Francois Tonneau

size 12 8

set font ss

include pole.gle

begin graph
    data "spider.dat" d1=c2,c4 d2=c2,c5
    axis off
end graph

myred$ = "#cd5c5c"
myblue$ = "#005d67"

wheelcenter pagewidth()/2 pageheight()/2
wheeldims 0.8 3.2
wheelvalues 0 100
startangles at 90 going clockwise

fillcloth "#f0edda"
set color gray10 lwidth 0.02 lstyle 22
drawsomerings 25 50 75

set lstyle 1
drawrays from 0 to 360 by 15 no last
drawclothcontour

drawpolarline d1 myred$ close end
drawpolarline d2 myblue$ close end

drawpolarpoints d1 color myred$ marker fcircle msize 0.1
drawpolarpoints d2 color myblue$ marker fcircle msize 0.1

set color gray70 hei 0.20

tagstyle just cc format "fix 0 append %"
writetags at 352 from 0 to 100 by 50

set color gray70 hei 0.25

labelstyle dist 0.4 just textual
writelabelsfrom "spider.dat"

set just cc
movepp 16 180
write 2016
movepp 71 195
write 2015
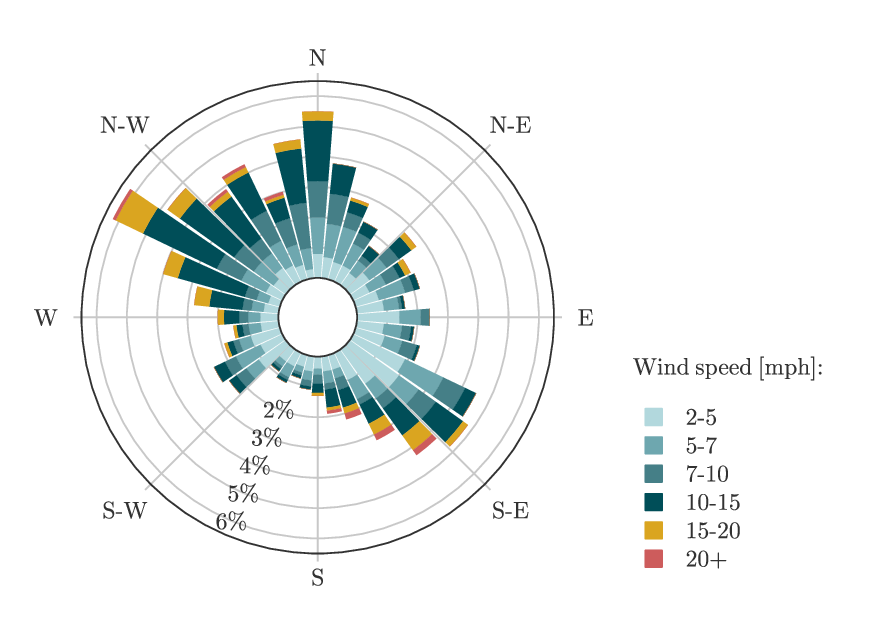
windrose.gle
 windrose.gle windrose.zip zip file contains all files for this figure.
windrose.gle
! Example of wind rose
! Author: Francois Tonneau

size 11 8

set font ss

include pole.gle

color_1$ = "#b2d8dd"
color_2$ = "#6ea7af"
color_3$ = "#457f87"
color_4$ = "#004e58"
color_5$ = "#daa520"
color_6$ = "#cd5c5c"

wheelcenter 4 4
wheeldims 0.5 3
wheelvalues 0 0.065

set color gray10
drawrays from 0 to 360 by 45 no last
drawticks from 0 to 360 by 45 no last
drawrings from 0.01 to 0.06 by 0.01

startangles at 90 going clockwise

drawpolarhist "windrose.dat" width 8.75 direction outward

set color gray70 just cc hei 0.3

drawclothcontour
writelabelsfrom "windrose.dat"

tagstyle format percent
writetags at 203 from 0.02 to 0.06 by 0.01

movepp 0.077 45
write "N-E"
movepp 0.077 135
write "S-E"
movepp 0.077 225
write "S-W"
movepp 0.077 -45
write "N-W"

set just tl hei 0.3
amove 8 3.5
write "Wind speed [mph]:"
begin key
    absolute 8 3 dist 0.3 just tl nobox
    marker fsquare color color_1$ text "2-5"
    marker fsquare color color_2$ text "5-7"
    marker fsquare color color_3$ text "7-10"
    marker fsquare color color_4$ text "10-15"
    marker fsquare color color_5$ text "15-20"
    marker fsquare color color_6$ text "20+"
end key