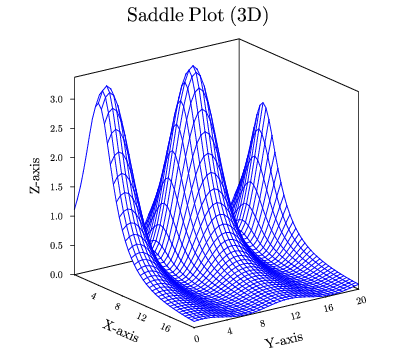
GLE Example: saddle.gle

[PDF file]
size 10 9

set font texcmr hei 0.5 just tc

begin letz
   data "saddle.z"
   z = 3/2*(cos(3/5*(y-1))+5/4)/(1+(((x-4)/3)^2))
   x from 0 to 20 step 0.5
   y from 0 to 20 step 0.5
end letz

amove pagewidth()/2 pageheight()-0.1
write "Saddle Plot (3D)"

begin object saddle
   begin surface
      size 10 9
      data "saddle.z"
      xtitle "X-axis" hei 0.35 dist 0.7
      ytitle "Y-axis" hei 0.35 dist 0.7
      ztitle "Z-axis" hei 0.35 dist 0.9
      top color blue
      zaxis ticklen 0.1 min 0 hei 0.25
      xaxis hei 0.25 dticks 4 nolast nofirst
      yaxis hei 0.25 dticks 4
   end surface
end object

amove pagewidth()/2 0.2
draw "saddle.bc"
[Return to examples page]
