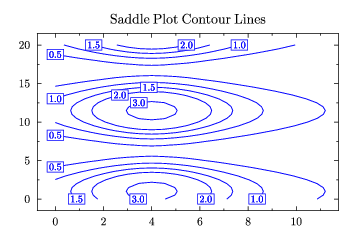
GLE Example: saddle-contour.gle

[PDF file]
size 9 6

include "contour.gle"

set font texcmr

begin letz
   data "saddle.z"
   z = 3/2*(cos(3/5*(y-1))+5/4)/(1+(((x-4)/3)^2))
   x from 0 to 20 step 0.5
   y from 0 to 20 step 0.5
end letz

begin contour
   data "saddle.z"
   values 0.5 1 1.5 2 3
end contour

begin graph
   scale 0.85 0.75 center
   title "Saddle Plot Contour Lines" hei 0.35
   data "saddle-cdata.dat"
   xaxis min -0.75 max 11.75
   yaxis min -1.5 max 21.5
   d1 line color blue
end graph

contour_labels "saddle-clabels.dat" "fix 1"
[Return to examples page]
