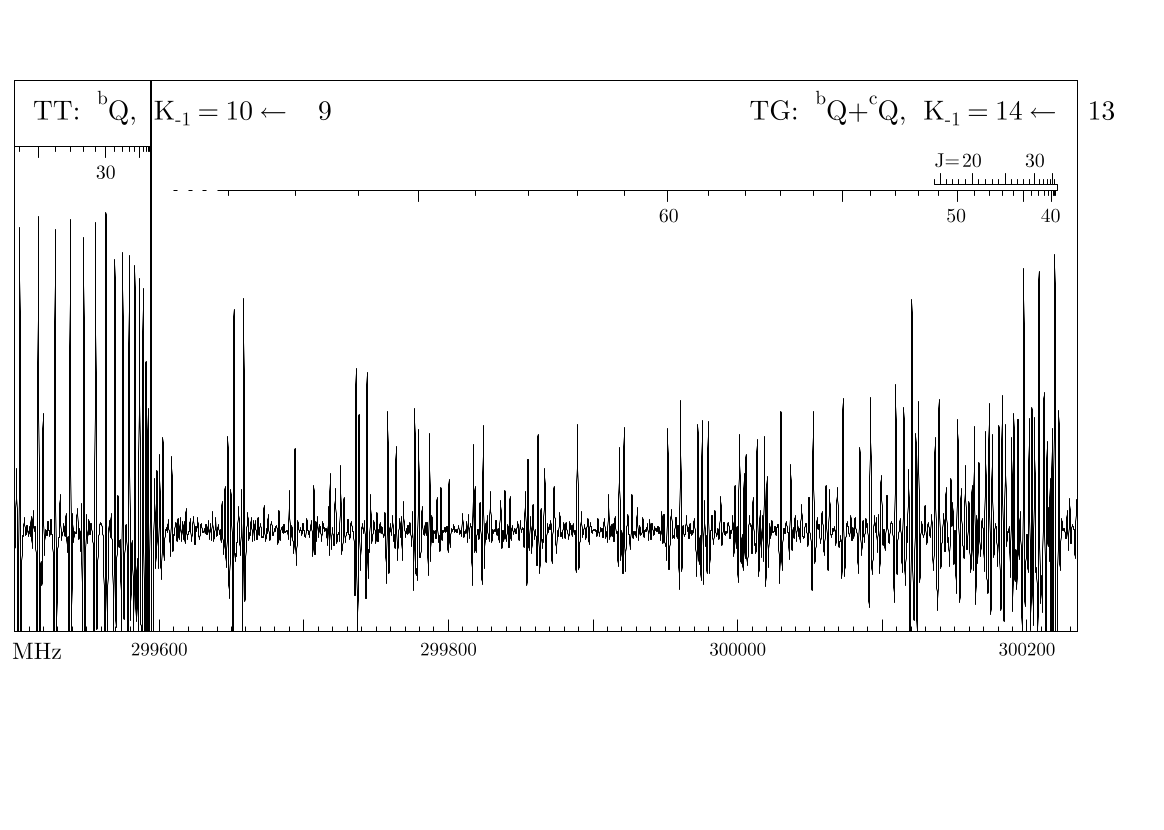
GLE Example: tgplot.gle

[PDF file]
!---------------------------------------------------------------------------
!      Plot of spectrum from file:  C:\ROT\ether\S\ohio\ether_o2b.spe
!---------------------------------------------------------------------------

size 29.5 21

set lwidth 0.025 join round font texcmr

amove -5.45  2.00
begin graph
    size 38.57 20.00
    d1 bigfile tgplot.dat
    xaxis  min  299500.02 max  300235.00 dticks    100.00 dsubticks    10.000
    x2ticks off
    xticks length 0.3
    xsubticks length 0.12
    xlabels hei 0.6
    yaxis min  0.0 max 1.0
    ylabels off
    yticks off
    d1 line
    d2 bigfile tgplota.dat
    d2 lstyle 1
    d3 bigfile tgplotb.dat
    d3 lstyle 1
    xplaces    299600   299700   299800   299900   300000   300100   300200
    xnames "   299600"   " "   "   299800"   " "   "   300000"   " "   "   300200"
end graph

set hei 0.6
amove 0.27  4.3
text MHz

set hei 0.7
amove 0.8 18.
text {\rm TT:}\, ^bQ{\rm,}\, {{\it K}_{{\tt-}{\rm1}}} {\rm = 10 \leftarrow\:\,9}

amove 19 18.
text {\rm TG:}\, ^bQ{\rm+}^cQ{\rm,}\, {{\it K}_{{\tt-}{\rm1}}} {\rm = 14 \leftarrow\:\,13}

set hei 0.5
labver=16.8
labbot=labver-1.4
amove 24.4 labver
text 20
amove 26.0 labver
text 30
amove 26.4 labbot
text 40
amove 24.0 labbot
text 50
amove 16.7 labbot
text 60

amove 2.4 16.5
text 30

amove 23.7 labver
text {\it J}=
[Return to examples page]
