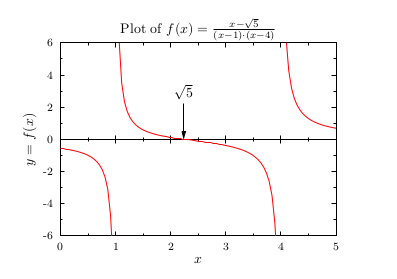
GLE Example: texgraph.gle

[PDF file]
size 10 7

set texlabels 1 titlescale 1
begin graph
   title   "Plot of $f(x) = \frac{x-\sqrt{5}}{(x-1)\cdot(x-4)}$"
   ytitle  "$y = f(x)$"
   x0title "$x$"
   xaxis min 0 max 5 dticks 1 offset 0 symticks
   yaxis min -6 max 6
   let d1 = (x-sqrt(5))/((x-1)*(x-4)) from 0 to 5
   d1 line color red
   xlabels off
   x0labels on
   x0axis on symticks off
   x2axis on symticks off
end graph

set just bc
amove xg(sqrt(5)) yg(2.5)
tex "$\sqrt{5}$" add 0.1 name sq5b

amove pointx(sq5b.bc) pointy(sq5b.bc)
aline xg(sqrt(5)) yg(0) arrow end
[Return to examples page]
