GLE Example: stack4c.gle

[PDF file]
size 15 23
set font texcmr hei 0.4

begin translate -1.25 -2.25
amove 1.3 19
begin graph
   size 16 6.5
   xaxis min 0 max 1800 dticks 300 dsubticks 100
   yaxis min 0 max 140 dticks 20 dsubticks 10
   xlabels off
   xticks length .2
   ylabels hei .4
   yticks length .2
   ytitle "Fruit weight (g)" hei .4
   data testc.dat
   d1 marker fcircle msize 0.2
   let d2 = (54.3+0.034*(x)) from 300 to 1700
   d2 line
end graph
rmove 3 4.5
text Poplar, shelter row

amove 1.3 14
begin graph
   size 16 6.5
   xaxis min 0 max 1800 dticks 300 dsubticks 100
   yaxis min 0 max 140 dticks 20 dsubticks 10 nolast
   xlabels off
   xticks length .2
   yticks length .2
   ylabels hei .4
   ytitle "Fruit weight (g)"  hei .4
   data testc.dat
   d1 marker fcircle msize 0.2
   let d2 = (47.2+0.045*(x)) from 300 to 1700
   d2 line
end graph
rmove 3 4.5
text Poplar, middle row

amove 1.3 9
begin graph
   size 16 6.5
   xaxis min 0 max 1800 dticks 300 dsubticks 100
   yaxis min 0 max 140 dticks 20 dsubticks 10 nolast
   xticks length .2
   xlabels off
   ylabels  hei .4
   yticks length .2
   ytitle "Fruit weight (g)" hei .4
   data testc.dat
   d1 marker fcircle msize 0.2
   let d2 = (53.3+0.040*(x)) from 300 to 1700
   d2 line
end graph
rmove 3 4.5
text Casuarina, shelter row

amove 1.3 4
begin graph
   size 16 6.5
   xaxis min 0 max 1800 dticks 300 dsubticks 100
   yaxis min 0 max 140 dticks 20 dsubticks 10 nolast
   xticks length .2
   xlabels hei .4
   yticks length .2
   ylabels hei .4
   ytitle "Fruit weight (g)" hei .4
   xtitle "Number of seeds per fruit"   hei .4
   data testc.dat
   d1 marker fcircle msize 0.2
   let d2 = (49.4+0.046*(x)) from 300 to 1500
   d2 line
end graph
rmove 3 4.5
text Casuarina, middle row
end translate

set just bc
amove pagewidth()/2 0.1
begin text width 14
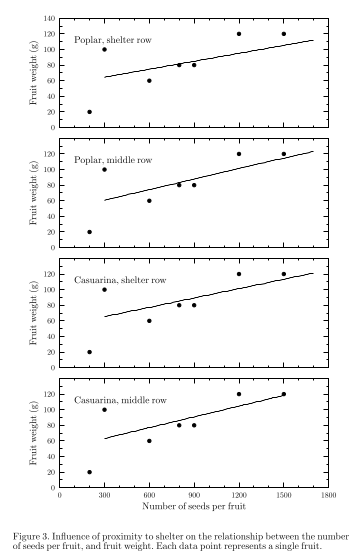
\setstretch{.1}Figure 3. Influence of proximity to shelter on the
relationship between the number of seeds per fruit, and fruit weight.
Each data point represents a single fruit.
end text
[Return to examples page]
