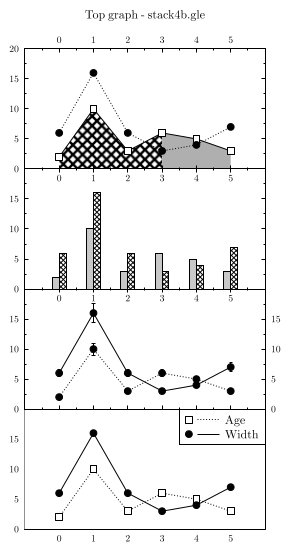
GLE Example: stack4b.gle

[PDF file]
size 12 23
set font texcmr hei 0.5

amove 1 16
begin graph
   size 10 5
   data test.dat
   title "Top graph - stack4b.gle" hei .5 dist 0.75
   fullsize
   xaxis min -1 max 6 dticks 1 nofirst nolast
   yaxis min 0 max 20 dticks 5
   x2labels on
   d1 marker wsquare msize 0.4 lstyle 1
   d2 marker fcircle msize 0.4 lstyle 2
   fill x1,d1 color grid4 xmax 3
   fill x1,d1 color gray20 xmin 3
end graph

rmove 0 -5
begin graph
   size 10 5
   data test.dat
   fullsize
   xaxis min -1 max 6 dticks 1 nofirst nolast
   yaxis min 0 max 20 dticks 5 nolast
   bar d1,d2 width .2 dist .2 fill gray10,grid3 color black,black
end graph

rmove 0 -5
begin graph
   data test.dat
   fullsize
   size 10 5
   xaxis min -1 max 6 dticks 1 nofirst nolast
   yaxis min 0 max 20 dticks 5 nolast
   xlabels off
   y2labels on
   d1 marker fcircle msize 0.4 lstyle 2 err 10%
   d2 marker fcircle msize 0.4 lstyle 1 err 10%
end graph

rmove 0 -5
begin graph
   data test.dat
   fullsize
   size 10 5
   xaxis min -1 max 6 dticks 1 nofirst nolast grid
   yaxis min 0 max 20 dticks 5 nolast grid
   xticks lstyle 2 lwidth 0.0001  	! sets the grid line style
   yticks lstyle 2 lwidth 0.0001
   d1 marker wsquare msize 0.4 lstyle 2 key "Age"
   d2 marker fcircle msize 0.4 lstyle 1 key "Width"
end graph
[Return to examples page]
