GLE Example: stack2.gle

[PDF file]
size 15.5 23.5
set font texcmr hei 0.4

amove 0 12
begin graph
   size 16 12
   ytitle  "Bud burst (%)"
   xaxis min 0 max 20 dticks 4  dsubticks 1
   yaxis min 0 max 75 dticks 10 dsubticks 5
   xplaces 2        6        10      14       18
   xnames  "Sep 13" "Sep 23" "Oct 3" "Oct 13" "Oct 23"
   data    "test4.dat"
   key pos br
   d1 lstyle 1 marker wcircle key "Shelter row"
   d2 lstyle 1 marker wsquare key "Shelter row + H"
   d3 lstyle 2 marker wcircle key "Middle row"
   d4 lstyle 2 marker wsquare key "Middle row + H"
end graph

amove 0 2
begin graph
   size 16 12
   ytitle "Flowers per cane at full bloom"
   xaxis min 0 max 20  dticks 4  dsubticks 1
   yaxis min 0 max 110 dticks 10 dsubticks 5
   xplaces 2        6        10      14       18
   xnames  "Sep 13" "Sep 23" "Oct 3" "Oct 13" "Oct 23"
   data    "test4.dat"
   d1 lstyle 1 marker circle
   d2 lstyle 1 marker square smooth
   d3 lstyle 2 marker circle smooth
   d4 lstyle 2 marker square
end graph

amove 0.4 1.5
begin text width 14.5
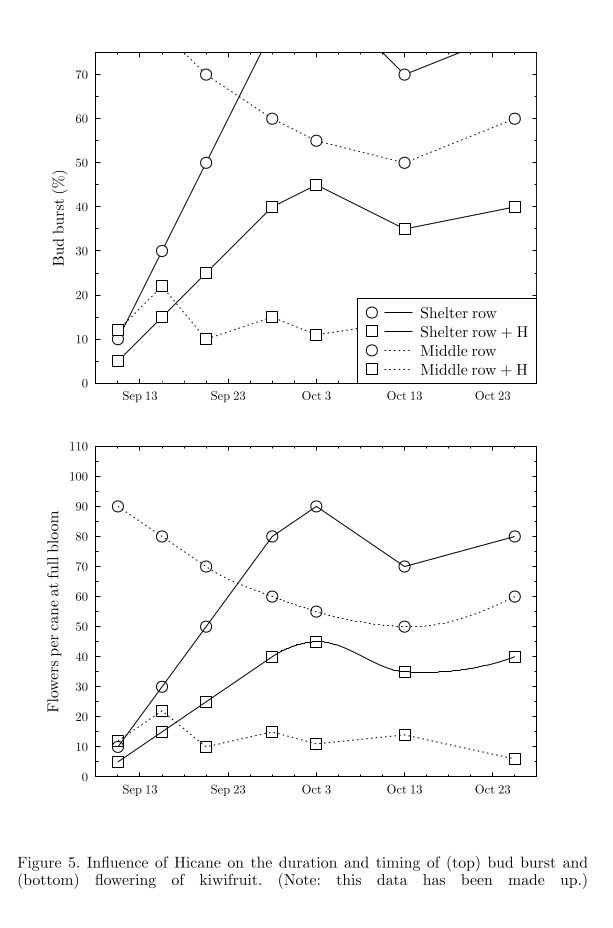
   Figure 5. Influence of Hicane on the duration and timing of (top) bud burst
   and (bottom) flowering of kiwifruit.  (Note: this data has been made up.)
end text
[Return to examples page]
