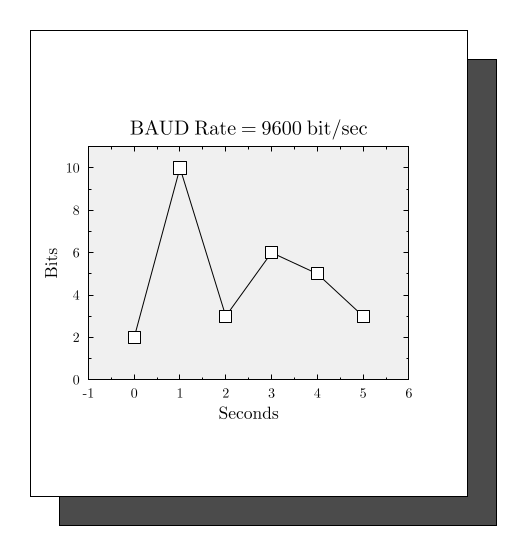
GLE Example: stack1.gle

[PDF file]
size 18 19

amove 2 1
box 15 16 fill gray60
rmove -1 1
box 15 16 fill white
rmove 2 4
box 11 8 fill gray5

set font texcmr hei 0.6

begin graph
	fullsize
	size 11 8
	title "BAUD Rate = 9600 bit/sec"
	xtitle "Seconds"
	ytitle "Bits"
	data "test.dat"
	d1 line marker wsquare
	xaxis min -1 max 6
	yaxis min 0 max 11
end graph
[Return to examples page]
