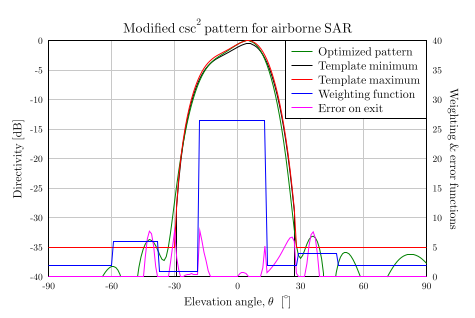
GLE Example: sarppepo.gle

[PDF file]
! This GLE file contains an example of how one can make "different plots" on a common graph;
! "different" in the sense that one plot uses the normal (i.e. left side) y-axis, while the other
! plot(s) uses the y2-axis (i.e. the right side). The two y-axis ("y" and "y2") can have fully
! arbitrary values.

size 12 8

set font texcmr hei 0.3
begin graph
    scale   0.8 0.75
    title   "Modified csc^2 pattern for airborne SAR"
    xtitle  "Elevation angle, \theta \, [^{\circ}]"
    ytitle  "Directivity [dB]"
    y2title "Weighting & error functions" rotate
    xaxis  min -90 max +90 dticks 30 grid
    yaxis  min -40 max 0   dticks 5  grid
    y2axis min 0   max 40  dticks 5
    ticks color gray10
    data "sarppepo.err" ignore 2
!
!   The datafile (SARppEPO.err) looks like this (only first few lines shown):
!   Theta,      MIN,        A_dB,       MAX,          F_error,   WEIGHT
!  (F_error = Function value at the solution)
!  -90.000000  -99.000000  -50.167945  -35.000000     .000977    2.000000
!  -89.000000  -99.000000  -49.854909  -35.000000     .000983    2.000000
!  -88.000000  -99.000000  -49.580417  -35.000000     .000988    2.000000
!  ...
!  ...
!  ...
!   90.000000  -99.000000  -37.707631  -35.000000     .001226    2.000000
! Last line having "theta" = 90.0
!
    d1 line                      ! Plot the first curve ("MIN") using the default color: Black.
    d2 line color green          ! Plot the second curve ("A_dB") in green...
    d3 line color red            ! Plot the third curve ("MAX") in red...
    d4 line y2axis color magenta ! Plot value of the error function on exit...
    d5 line y2axis color blue    ! Plot weighting function...
end graph

begin key
   pos tr
   text "Optimized pattern"  line color green
   text "Template minimum"   line color black
   text "Template maximum"   line color red
   text "Weighting function" line color blue
   text "Error on exit"      line color magenta
end key
[Return to examples page]
