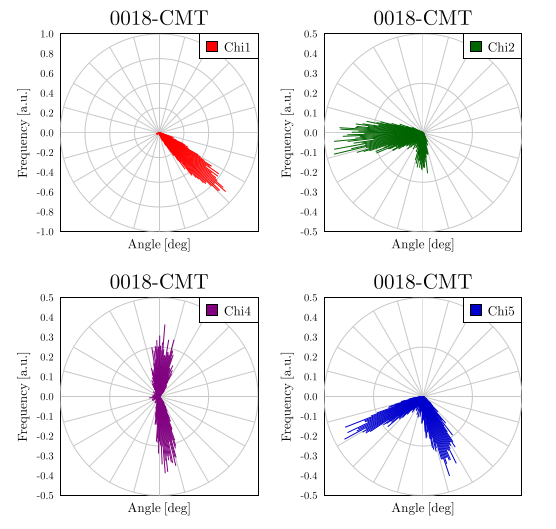
GLE Example: polar_histogram.gle

[PDF file]
size 21 20

include "polarplot.gle"

set font texcmr

sub draw_histogram dataset$ series scale color$ key$ title$
  set hei 0.5
  begin graph
     size 10 10
     scale 0.75 0.75
     title title$ hei 0.8
     xaxis min -1/scale max 1/scale
     yaxis min -1/scale max 1/scale
     xtitle "Angle [deg]"
     xlabels off
     ytitle "Frequency [a.u.]"
     xticks off
     yticks off
     data "0018-CMT.hist" d1=c1,c[series]
     draw polar_grid radius 1/scale rings 4/scale sectors 24
     draw polar_data d1 color color$ type line
  end graph
  begin key
    position tr
    fill color$ text key$
  end key
end sub

amove 1 10
draw_histogram dataset$ 4 scale 1 color red key "Chi1" title "0018-CMT"

amove 11 10
draw_histogram dataset$ 5 scale 2 color darkgreen key "Chi2" title "0018-CMT"

amove 1 0
draw_histogram dataset$ 7 scale 2 color purple key "Chi4" title "0018-CMT"

amove 11 0
draw_histogram dataset$ 8 scale 2 color mediumblue key "Chi5" title "0018-CMT"
[Return to examples page]
