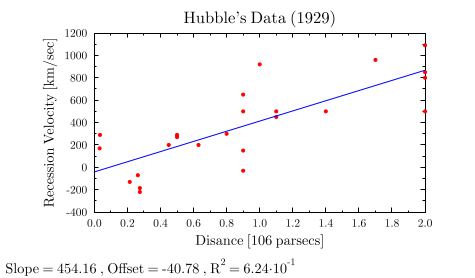
GLE Example: hubble.gle

[PDF file]
! plot of Hubble's data to demonstrate GLE's fitting routines

size 12 7

set font texcmr

amove 0 0.5
begin graph
   size 12 6.5 center
   title  "Hubble's Data (1929)"
   xtitle "Disance [106 parsecs]"
   ytitle "Recession Velocity [km/sec]"
   data   "hubble.dat" d1=c3,c4 ignore 1
   d1 marker fcircle msize 0.11 color red
   let d2 = linfit d1 slope ofset rsquared
   d2 line color blue
end graph

amove 0.1 0.1
write "Slope = " format$(slope,"fix 2") ", Offset = " format$(ofset,"fix 2") ",  R^2 = " format$(rsquared,"sci 3 10")
[Return to examples page]
