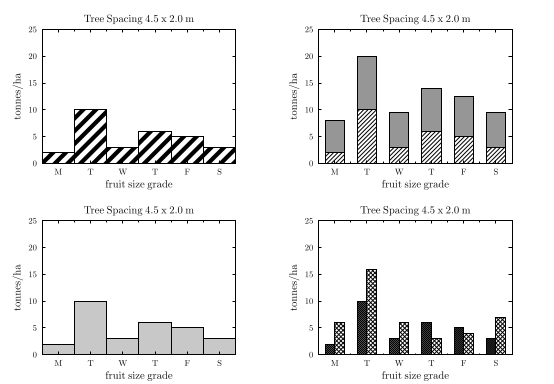
GLE Example: four.gle

[PDF file]
size 26 18
set font texcmr hei 0.5 titlescale 1

amove  0 0
begin graph
   size 13 9
   title  "Tree Spacing 4.5 x 2.0 m"
   xtitle "fruit size grade"
   ytitle "tonnes/ha"
   data   "test.dat"
   xaxis  min -0.5 max 5.5 dticks 1
   yaxis  min 0 max 25 dsubticks 10
   xnames "M" "T" "W" "T" "F" "S"
   bar d1 width 1.0 fill gray10
end graph

amove  0 9
begin graph
   size 13 9
   title  "Tree Spacing 4.5 x 2.0 m"
   xtitle "fruit size grade"
   ytitle "tonnes/ha"
   data   "test.dat"
   xaxis  min -0.5 max 5.5 dticks 1
   yaxis  min 0 max 25 dsubticks 10
   xnames "M" "T" "W" "T" "F" "S"
   bar d1 width 1.0 fill shade5
end graph

amove  13 9
begin graph
   size 13 9
   title  "Tree Spacing 4.5 x 2.0 m"
   xtitle "fruit size grade"
   ytitle "tonnes/ha"
   data   "test.dat"
   xaxis  min -0.5 max 5.5 dticks 1
   yaxis  min 0 max 25 dsubticks 10
   xnames "M" "T" "W" "T" "F" "S"
   bar d1 width 0.6 fill shade
   let d3 = d1+5+0.5*d1
   bar d3 from d1 width 0.6 fill gray30
end graph

amove  13 0
begin graph
   size 13 9
   title  "Tree Spacing 4.5 x 2.0 m"
   xtitle "fruit size grade"
   ytitle "tonnes/ha"
   data   "test.dat"
   xaxis  min -0.5 max 5.5 dticks 1
   yaxis  min 0 max 25 dsubticks 10
   xnames "M" "T" "W" "T" "F" "S"
   bar d1,d2 fill grid1,grid3 width 0.3 dist 0.3
end graph
[Return to examples page]
