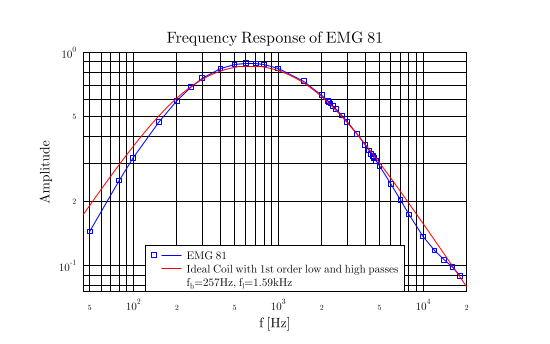
GLE Example: filters81.gle

[PDF file]
size 24 15

! Highpass Data
Rh = 9.1e3; Ch = 68e-9

! Lowpass Data
Rl = 1e3; Cl = 100e-9

sub f x
   ! Frequency response with low impedance coil L <= 1 Henry
   ! 1st order Low- and Highpasses
   f1 = Rh/sqrt(1/(4*pi^2*x^2*Ch^2)+Rh^2)
   f2 = 1/sqrt(1+4*pi^2*x^2*Cl^2*Rl^2)
   return f1*f2
end sub

set font texcmr hei 0.6
begin graph
  title  "Frequency Response of EMG 81"
  xtitle "f [Hz]"
  ytitle "Amplitude"
  data   "emg81ndiv.dat"
  xaxis min 45    max 20000 grid log format "sci 0 10"
  yaxis min 0.075 max 1     grid log format "sci 0 10"
  let d13 = d3*8
  d13 marker square msize 0.3 line color blue
  let d33 = f(x) step 100
  d33 line color red
end graph

begin key
  pos bc hei 0.49
  marker square msize 0.3 line color blue text "EMG 81"
  line color red text "Ideal Coil with 1st order low and high passes"
  text "f_h=257Hz, f_l=1.59kHz"
end key
[Return to examples page]
