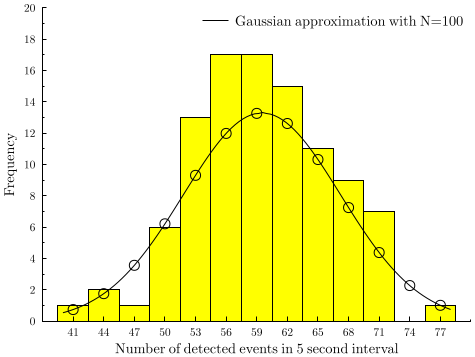
GLE Example: decay.gle

[PDF file]
! Demonstration of the bar command with data from radioactive decay

size 12 9

mu = 59.51; sigma = mu^0.5      ! These are the parameters of the gaussian approximation
N = 100                         ! The number of timed intervals

sub gaussian x
   return (N/3)/((2*pi)^0.5)*exp(-((x-mu)^2)/(2*sigma^2))
end sub

set font texcmr
begin graph
   scale auto
   xtitle "Number of detected events in 5 second interval"
   ytitle "Frequency"
   xaxis min 38 max 80 ftick 41 dticks 3 nolast
   yaxis max 20
   x2axis off
   y2axis off
   key pos tr nobox
   data "decay.dat"                                ! Data taken from the experiment
   let d2 = gaussian(x) from 40 to 78              ! Sets our Gaussian into both "continuous" and
   let d3 = gaussian(x) from 41 to 77 step 3       ! discrete forms
   bar d1 width 3 fill yellow
   d2 line key "Gaussian approximation with N=100"
   d3 marker circle
end graph
[Return to examples page]
