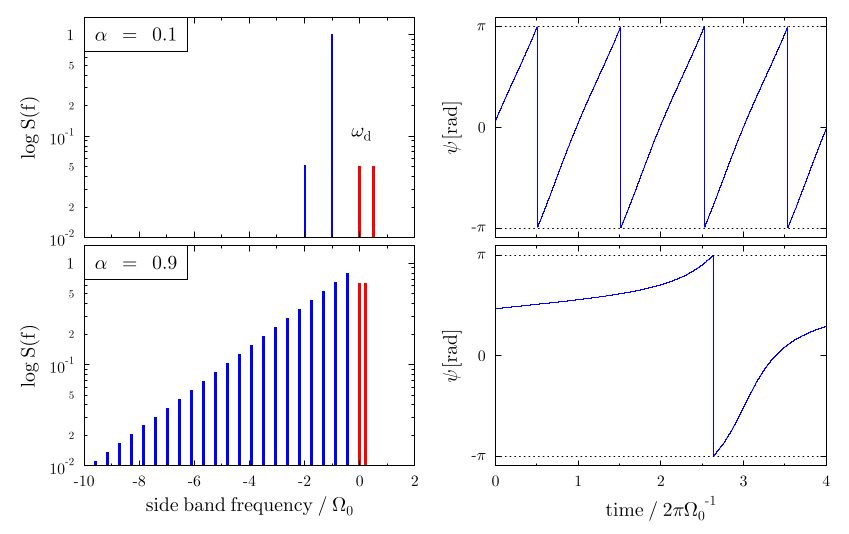
GLE Example: armand.gle

[PDF file]
size 21.5 13.5

set font texcmr hei 0.5
a = 0.9; t = asin(a); s = sqrt(1-a^2)

amove 0.3 0.5
begin graph
  size 12 8
  xtitle "side band frequency / \Omega_0"
  ytitle "log S(f)"
  xaxis min -10   max 2
  yaxis min 10^-2 max 1.5 log
  let d1 = tan(t/2)                         from 0     to s/2 step s
  let d2 = (1-tan(t/2)^2)*(tan(t/2)^(-x-1)) from -46*s to -s  step s
  bar d1 width 0.05 color red  fill red
  bar d2 width 0.05 color blue fill blue
end graph

begin key
   position tl
   text "\alpha\:=\:0.9"
end key

a = 0.1; t = asin(a); s = sqrt(1-a^2)

amove 0.3 6.3
begin graph
  size 12 8
  xlabels off
  ytitle "log S(f)"
  xaxis min -10   max 2
  yaxis min 10^-2 max 1.5 log
  let d1 = tan(t/2)                         from 0      to s/2 step s
  let d2 = (1-tan(t/2)^2)*(tan(t/2)^(-x-1)) from -100*s to -s  step s
  bar d1 width 0.05 color red  fill red
  bar d2 width 0.05 color blue fill blue
end graph

begin key
   position tl
   text "\alpha\:=\:0.1"
end key

amove xg(-0.3) yg(0.1)
write "\omega_d"

a = 0.9; omega = sqrt(1-a^2)

amove 10.75 0.5
begin graph
  size 12 8
  xtitle "time / 2\pi\Omega_0^{-1}"
  ytitle "\psi\,\,[rad]"
  xaxis min 0       max 4 dticks 1
  yaxis min -0.3-pi max pi+0.3 ftick -pi dticks pi format "pi"
  ysubticks off
  let d1 = 2*atn(a+sqrt(1-a^2)*tan(0.5*sqrt(1-a^2)*omega*2*pi*x)) step 0.001
  d1 line color blue
end graph

set lstyle 2
amove xg(0) yg(-pi)
aline xg(4) yg(-pi)
amove xg(0) yg(pi)
aline xg(4) yg(pi)
set lstyle 0

a = 0.1; omega = sqrt(1-a^2)

amove 10.75 6.3
begin graph
  size 12 8
  ytitle "\psi\,\,[rad]"
  xaxis min 0       max 4 dticks 1
  yaxis min -0.3-pi max pi+0.3 ftick -pi dticks pi format "pi"
  ysubticks off
  xlabels off
  let d1 = 2*atn(a+sqrt(1-a^2)*tan(0.5*sqrt(1-a^2)*omega*2*pi*x)) step 0.001
  d1 line color blue
end graph

set lstyle 2
amove xg(0) yg(-pi)
aline xg(4) yg(-pi)
amove xg(0) yg(pi)
aline xg(4) yg(pi)
set lstyle 0
[Return to examples page]
