GLE Example: adphas.gle

[PDF file]
! Nice example by Axel Rohde

size 22 24
set font texcmr hei 0.55
x1 = -0.15; x2 = 0.6; xstep = 0.001

sub f x a
   return pi+2*atn(a-sqrt(1-a^2)*tan(25*x*sqrt(1-a^2)/2))
end sub

sub do_label s$
   gsave
   set just cc
   amove 0.75 yg(ygmax)+1
   write s$; circle 0.4
   grestore
end sub

amove 0 14
begin graph
  size 25 9
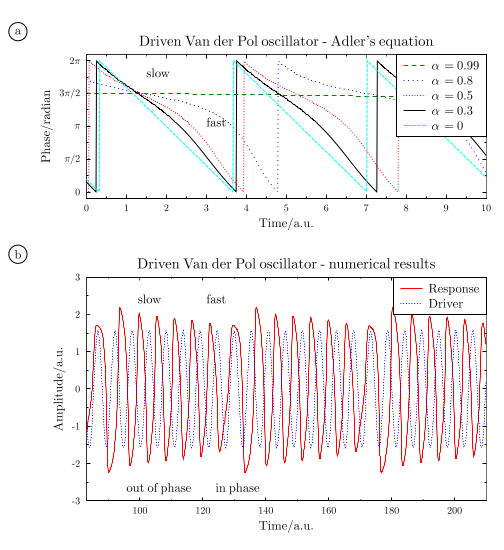
  title  "Driven Van der Pol oscillator - Adler's equation"
  xtitle "Time/a.u."
  ytitle "Phase/radian"
  xaxis min 0  max 10
  yaxis min -0.3 max 2*pi+0.3 ftick 0 dticks pi/2 format "pi"
  key position tr
  let d1 = f(x,0.99)  from x1  to   x2 step xstep
  d1 line color green lstyle 9 xmin x1 xmax x2 key "\alpha\,= 0.99"
  let d2 = f(x,0.8)   from  x1 to   x2 step xstep
  d2 line color blue  lstyle 4 xmin x1 xmax x2 key "\alpha\,= 0.8"
  let d3 = f(x,0.5)   from  x1 to   x2 step xstep
  d3 line color red   lstyle 2 xmin x1 xmax x2 key "\alpha\,= 0.5"
  let d4 = f(x,0.3)   from  x1 to   x2 step xstep
  d4 line color black lstyle 0 xmin x1 xmax x2 key "\alpha\,= 0.3"
  let d5 = f(x,0)     from x1  to   x2 step xstep
  d5 line color cyan  lstyle 3 xmin x1 xmax x2 key "\alpha\,= 0"
end graph

do_label "a"

amove xg(3) yg(3.14)
write "fast"
amove xg(1.5) yg(5.5)
write "slow"

amove 0 0
begin graph
   size 25 14
   title  "Driven Van der Pol oscillator - numerical results"
   xtitle "Time/a.u."
   ytitle "Amplitude/a.u."
   xaxis min 83 max 210
   yaxis min -3 max 3
   data "resp.dat"
   let d4 = d3*1.2
   key position tr
   d1 line smooth lstyle 1 color red  key "Response"
   d4 line smooth lstyle 2 color blue key "Driver"
end graph

do_label "b"

amove 9 yg(2.3)
write "fast"
amove 6 yg(2.3)
write "slow"
amove 5.5 2.5
write "out of phase"
amove 9.4 2.5
write "in phase"
[Return to examples page]
