Other
Other uncatagorized figures.
barcode_example.gle
barcode_example.gle
include "barcode.gle"

! GLE file that draws EAN-13 barcodes
! Author: Jan Soubusta

size sx+.2 sy+.2
amove .1 .1
draw bar_code.bl 8 "594005" "530744" "Water"
business_cards_10_per_A4.gle
business_cards_10_per_A4.gle
papersize a4paper
size 21.0 29.7
!============================================================================
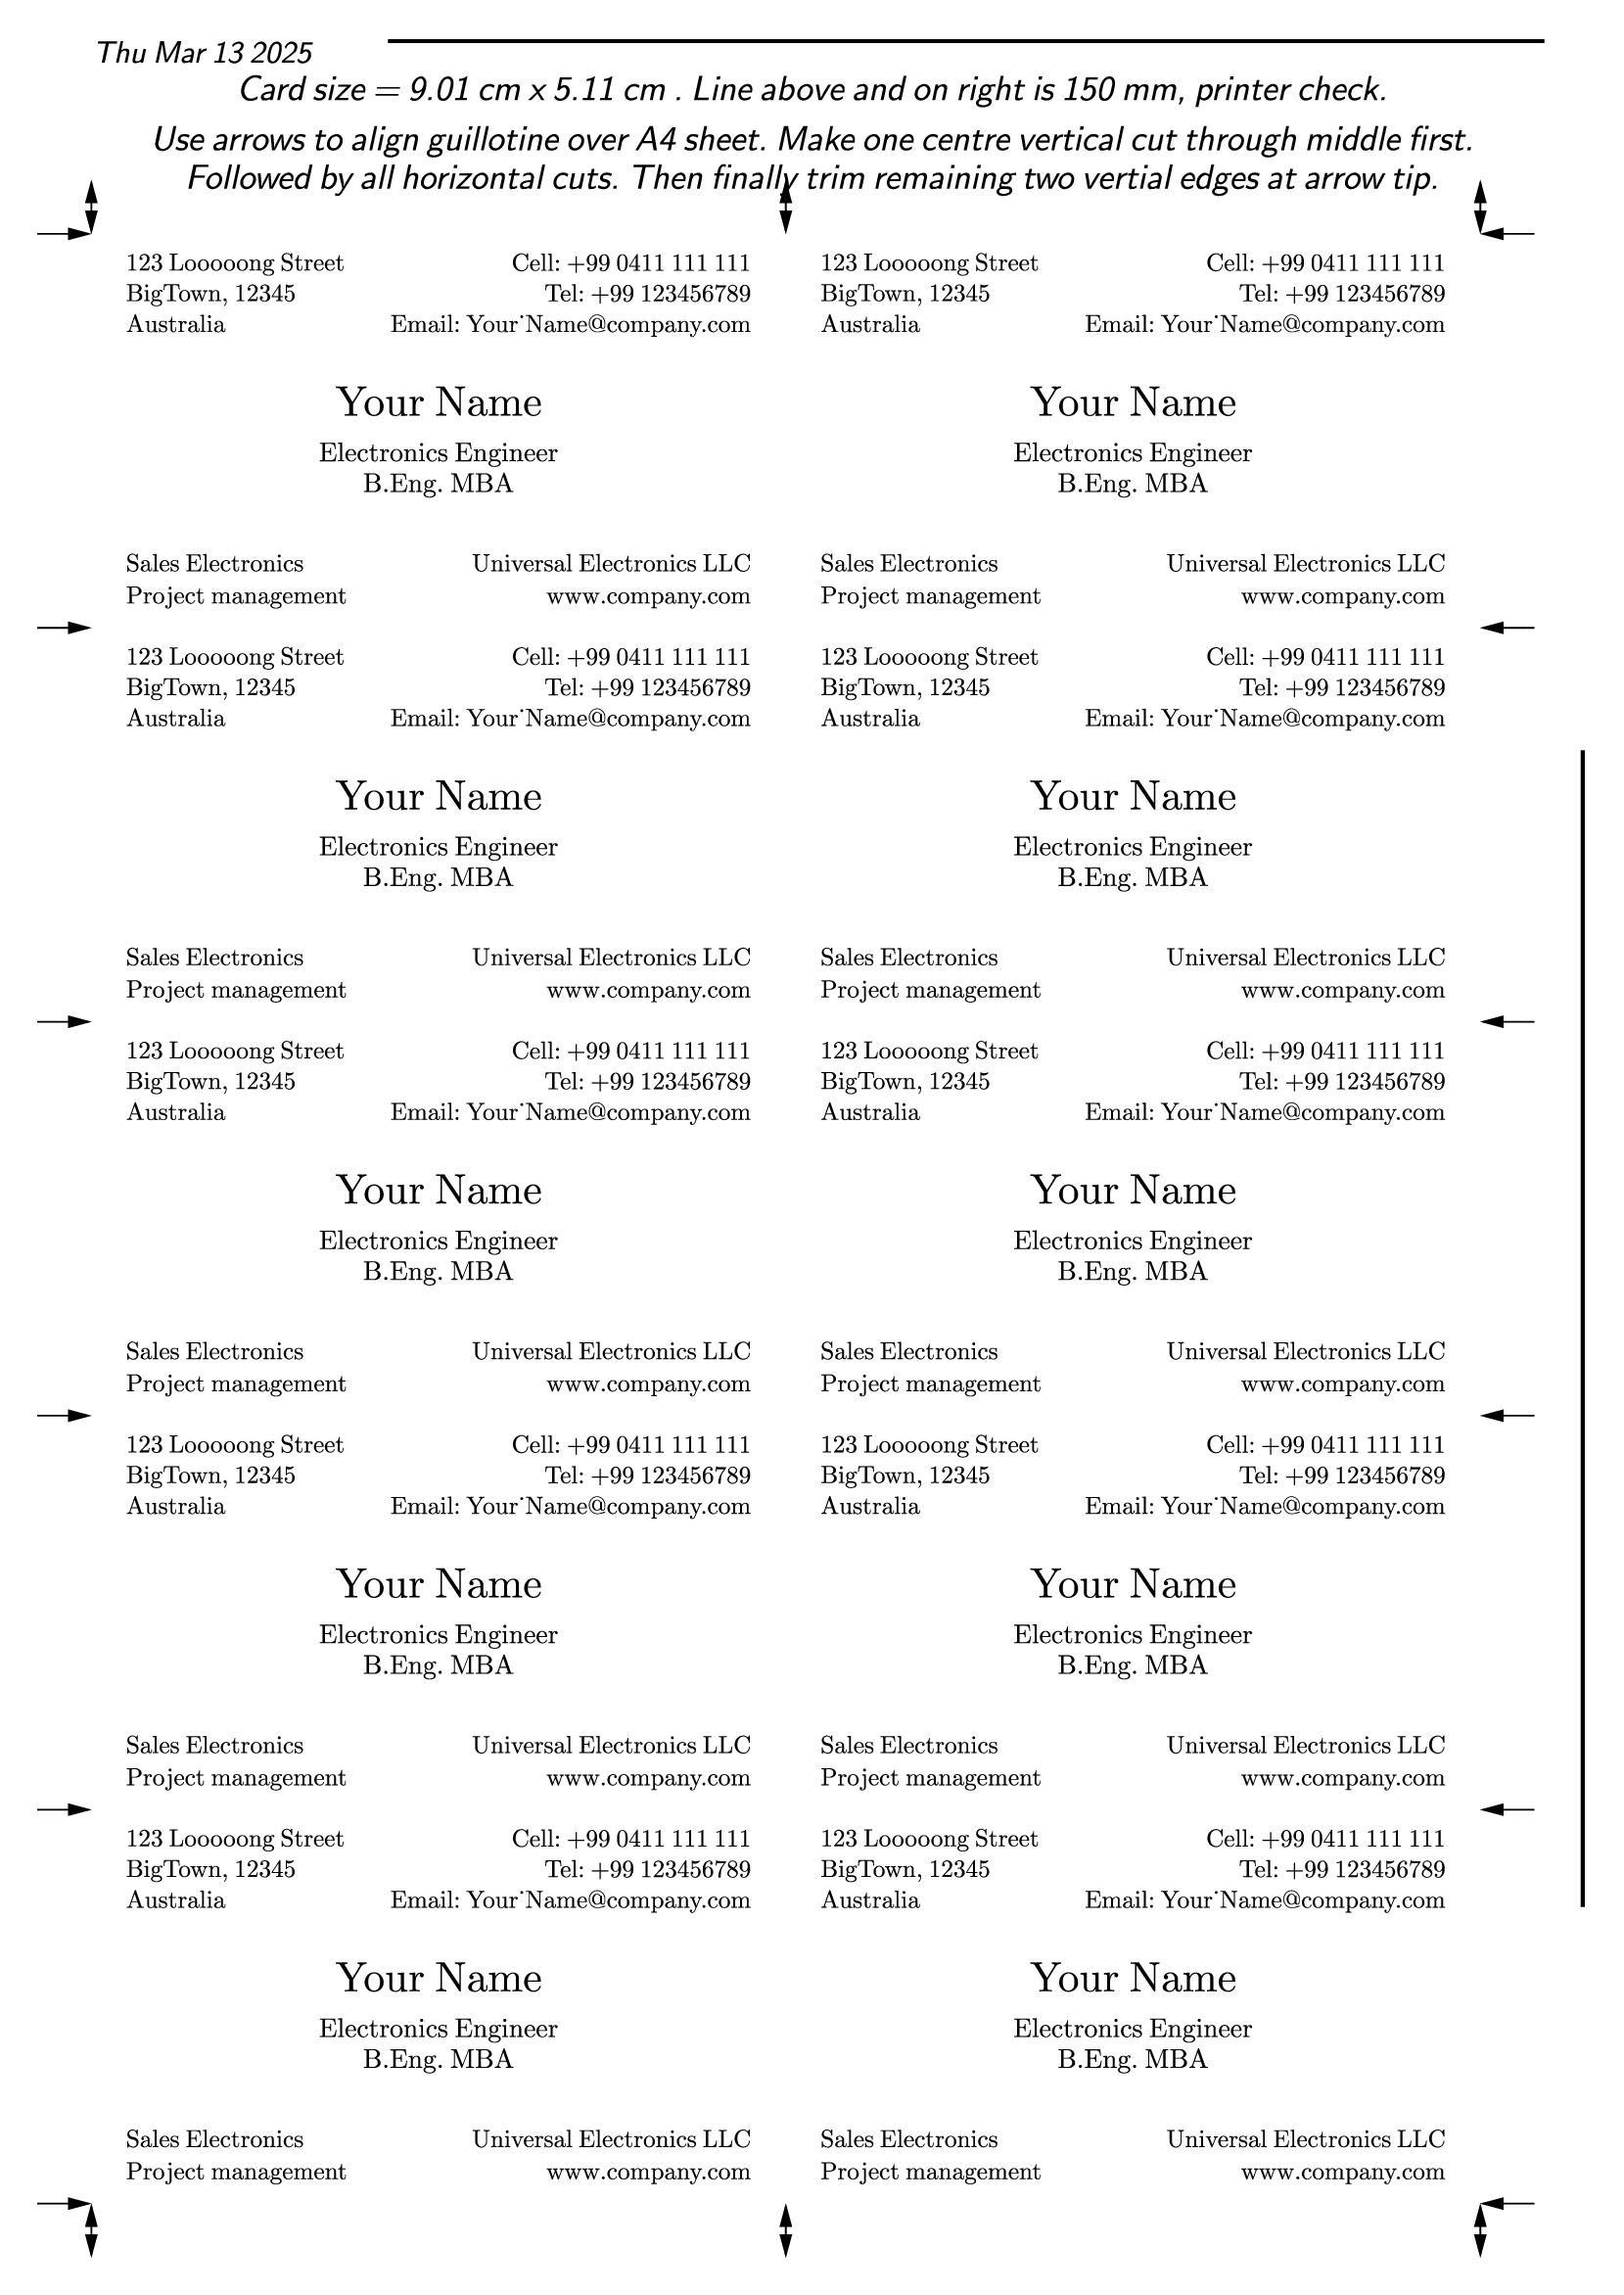
! this gle script produces 10 business cards on an A4 sheet
! Use any good paper, photo or board.
! Not aligned to pre-perforated sheets !!!!
! use the arrow marks to align guillotine.
! for accurate sizing, set printer to NO PAGE SCALING
! If you want border enable the : box card_width card_height code below
!
! author: emile
! march 2010.
!============================================================================
! modify the fields below with your details.
name$ = "Your Name"
mobile$ = "+99 0411 111 111"
telephone$ = "+99 123456789"
title$ = "Electronics Engineer"
post_nominals$ ="B.Eng. MBA"
email$ = "Your\_Name@company.com" !note escape for underscore
jobs1$ = "Sales Electronics"
jobs2$ = "Project management"
Website$ = "www.company.com"
Company$ = "Universal Electronics LLC"
Street$ = "123 Looooong Street"
City$ = "BigTown, 12345"
Country$ = "Australia"
!--- choose yor font here
set font ssb ! psagb pshn psncsr psagb sets global font; these fonts work ok
!slightly modify font heights here. Values are in cm
name_height = 0.55 !
info_height = 0.32 ! corner texts
qualifications_height = 0.35 ! appears under name
margin_offset = 1.15 ! cm ; used to set left and bottom margin
!============== Modify below at own risk 0.01 cm allowed for offcut
paper_width = 21.0 ! A4 sheer
paper_height = 29.7
card_width = 9.01 ! cm
card_height = 5.11 ! cm This is slightly smaller than some.
!=============================================================================
gutter = 0 ! do not change , use only if you want to have gap between cards,
sub card
begin origin
gsave
amove 0 0
! ============= Optional box border ===============================
! set lwidth 0.18
! box card_width card_height
! if you want to have a border convert the above comment to script, remove the !
set color black
!---- write name, title, qualifications
set hei name_height
set just bc
amove card_width/2 card_height/2+0.2
write name$
set just tc
amove card_width/2 ((card_height/2)-qualifications_height+0.2)
set hei qualifications_height
write title$
set just tc
amove card_width/2 ((card_height/2)-2.15*qualifications_height+0.2)
set hei qualifications_height
write post_nominals$
!=================== write contacts ===========================
set just tr
amove card_width*0.95 (card_height*0.95)
set hei info_height
write "Cell: " mobile$
set just tr
amove card_width*0.95 (card_height*0.95- (info_height*1.24 ))
set hei info_height
write "Tel: " telephone$
set just tr
amove card_width*0.95 (card_height*0.95- 2*(info_height*1.24))
set hei info_height
write "Email: " email$
!=================== write address ===========================
set just tl
amove card_width*0.05 (card_height*0.95)
set hei info_height
write Street$
set just tl
amove card_width*0.05 (card_height*0.95-( info_height*1.24))
set hei info_height
write City$
set just tl
amove card_width*0.05 (card_height*0.95-2*( info_height*1.24))
set hei info_height
write Country$
!============== write services=====================
set just bl
amove card_width*0.05 (card_height*0.05)
set hei info_height
write jobs2$
set just bl
amove card_width*0.05 (card_height*0.05+(info_height*1.5))
set hei info_height
write jobs1$
!================ write company and website===============================
set just br
amove card_width*0.95 (card_height*0.05)
set hei info_height
write Website$
set just br
amove card_width*0.95 (card_height*0.05+(info_height*1.5))
set hei info_height
write Company$
grestore
end origin
end sub
!====================================================
! draw cards
for k = margin_offset to ( paper_width - card_width ) step (card_width + gutter)
for p = margin_offset to ( paper_height - card_height) step (card_height + gutter)
amove k p
@card
next p
next k
!====================================================================
!draw cut marks horizontal
for k = margin_offset to ( paper_width ) step (card_width + gutter)
set arrowstyle filled
set arrowsize 0.3
amove k margin_offset
rline 0 -0.7 arrow both
amove k (card_height*5+margin_offset )
rline 0 0.7 arrow both
next k
!draw cut marks vertical
for p = margin_offset to ( paper_height ) step (card_height + gutter)
set arrowstyle filled
set arrowsize 0.3
set font texcmssi
amove margin_offset p
rline -0.7 0 arrow start
amove ((card_width*2)+margin_offset ) p
rline 0.7 0 arrow start
next p
!======================= print instructions
amove 4 paper_height-0.5
set just tr
set hei 0.4
write date$()
amove 5 paper_height-0.5
set lwidth 0.05
rline 15 0
set hei 0.45
!=============== write top instructions
amove paper_width/2 paper_height-0.95
set just tc
write "Card size =" card_width " cm x " card_height "cm . Line above and on right is 150 mm, printer check."
amove paper_width/2 paper_height-1.6
set just tc
write "Use arrows to align guillotine over A4 sheet. Make one centre vertical cut through middle first."
amove paper_width/2 paper_height-2.1
set just tc
write "Followed by all horizontal cuts. Then finally trim remaining two vertial edges at arrow tip."
amove paper_width-0.5 5
rline 0 15
clip.gle
 clip.gle clip.zip zip file contains all files for this figure.
clip.gle
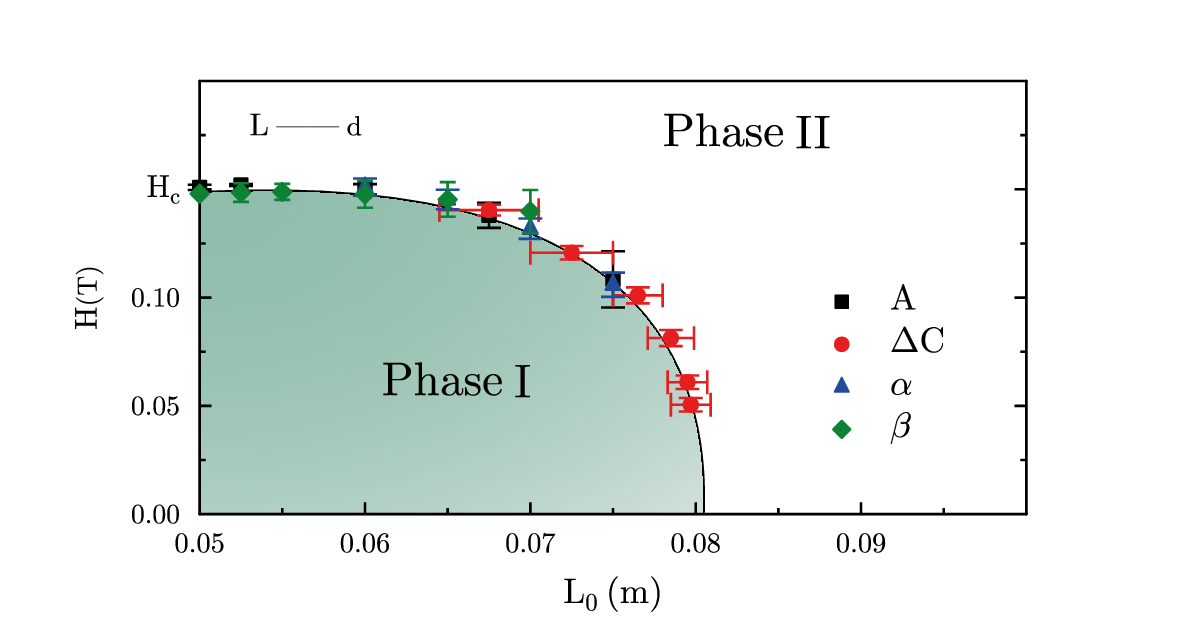
! Example with a clipped color gradient.
! Author: Francois Tonneau

size 15 8

left  = 0.05
right = 0.0804
top   = 0.1480

reddish  = rgb255(229,  30,  32)
blueish  = rgb255( 33,  76, 155)
greenish = rgb255( 13, 130,  53)

set font ss lwidth 0.03

amove 2.5 1.5

! We plot the data as a series of scatter plots with error lines.

begin graph
    size 10.5 5.5
    fullsize
    xaxis min 0.05 max 0.10 dticks 0.01 nolast format "fix 2"
    yaxis min 0.00 max 0.20 dticks 0.05 nolast format "fix 2"
    ticks length 0.15
    x2ticks off
    labels hei 0.45 dist 0.25
    ynames "\sethei{0.35}0.00" 0.05 0.10 "\sethei{0.4}{\it H}_{c}"
    xtitle "{\it L_{0}} (m)" dist 0.30
    ytitle "\sethei{0.4}{\it H}\sethei{0.35}(T)" dist 0.35

    data "clip.dat" &
        d1=c1,c2   d2=c1,c3 &
        d3=c4,c5   d4=c4,c6 &
        d5=c7,c8   d6=c7,c9 &
        d7=c10,c11 d8=c10,c12 &
        d9=c4,c13

    d1 marker fsquare   color black    msize 0.23
    d3 marker fcircle   color reddish  msize 0.25
    d5 marker ftriangle color blueish  msize 0.26
    d7 marker fdiamond  color greenish msize 0.32

    ! Most of the error lines are vertical ('err'), but we also add horizontal
    ! error lines ('herr') to dataset d3:

    d1 err  d2 errwidth  0.3 lwidth 0.03
    d3 err  d4 errwidth  0.3 lwidth 0.03
    d5 err  d6 errwidth  0.3 lwidth 0.03
    d7 err  d8 errwidth  0.2 lwidth 0.03

    d3 herr d9 herrwidth 0.3 lwidth 0.03

    ! Now we draw a colored gradient/region, using a low-rank layer to stay
    ! behind the data points and the axes:

    begin layer 300
        draw filled_region
    end layer

end graph

! In GLE, gradients/colormaps occupy a rectangular area, whereas we want our
! colored gradient to fill a curved contour. The solution is to use the contour
! as a boundary and clip the gradient after it. This involves four steps:
!
! 1. Begin a clipping block to save GLE's default clipping state, which will be
!    restored later.
!
! 2. Write a 'begin path ... end path' block with the 'clip' option on. Until
!    the end of the clipping block, anything drawn after the path will remain
!    clipped inside it.
!
! 3. Move to what will be the lower left corner of the gradient/colormap, and
!    draw the rectangular gradient. Because of step (2), the visible gradient
!    will stay inside the clipping path.
!
! 4. End the clipping block, restoring the default clipping state.

sub filled_region
    begin clip

        amove xg(left)  yg(0)

        set lwidth 0.06
        begin path clip stroke
            aline xg(right) yg(0)
            aline xg(left) yg(top) curve 88 3 1.4 6.1
            closepath
        end path

        amove xg(left) yg(0)

        ! As we know, a colormap associates to each point of a rectangle a
        ! number f that ranges from 0 to 1 and that depends on the (x, y)
        ! coordinates of this point. When used with the 'palette' option,
        ! the colormap command takes the following arguments:
        !
        ! "f(x,y)", a formal expression of x and y
        !
        ! x0 and x1, the initial and final values of x along the x-axis
        !
        ! y0 and y1, the initial and final values of y along the y-ayis
        !
        ! the number of steps for x and the number of steps for y
        !
        ! the width and height of the rectangle in cm
        !
        ! palette 'pal', where 'pal' refers to a subroutine that maps numbers
        ! in the 0-1 range to colors.

        ! In our example, we let x and y range from 0 to 1 in 50 steps each. Our
        ! "f(x,y)" expression is "z(x,y)", in reference to a 'z' subroutine we
        ! define below, and our palette is 'sky', also defined below. We add a
        ! small amount of padding to each side of the gradient rectangle to
        ! make sure that our region is well covered and that no whitespace
        ! shows through:

        local padding = 0.1

        local x0 = 0
        local x1 = 1
        local y0 = 0
        local y1 = 1
        local nx = 50
        local ny = 50
        local width  = xg(right) - xg(left) + padding
        local height = yg(top) - yg(0) + padding

        colormap "z(x,y)" x0 x1 y0 y1 nx ny width height palette sky

    end clip
end sub

! Here is the subroutine that assigns a value in the 0-1 range to each point of
! the gradient rectangle. (The name, 'z', is arbitrary; we could have chosen any
! other name, as long as we make reference to it in our colormap command.) The
! returned value is a linear function of the distance from (x, y) to the upper
! left corner of the rectangle, (0, 1):

sub z x y
    local  distance = (x - 0)^2 + (y - 1)^2
    local  maximum  = (1 - 0)^2 + (0 - 1)^2
    local  gain     = 0.7
    local  value    = gain * distance/maximum
    return value
end sub

! Finally, our 'sky' palette. A palette is a subroutine that takes a numeric
! argument as input and that returns a valid GLE color. The argument is assumed
! to be in the 0-1 range. In the case of our sky palette, the returned rgb255
! value is a linear mixture of two colors in standard RGB space:

sub sky z
    local r_cool = 143; local g_cool = 189; local b_cool = 172
    local r_warm = 240; local g_warm = 240; local b_warm = 240
    local r = z * r_warm + (1 - z) * r_cool
    local g = z * g_warm + (1 - z) * g_cool
    local b = z * b_warm + (1 - z) * b_cool
    return rgb255(r, g, b)
end sub

! We finish the figure by adding a legend and two labels:

begin key
    absolute 10.30 4.65 nobox just tl dist 0.5 hei 0.45
    marker fsquare   color black    msize 0.23 text "{\it A}"
    marker fcircle   color reddish  msize 0.25 text "\Delta {\it C}"
    marker ftriangle color blueish  msize 0.26 text \alpha
    marker fdiamond  color greenish msize 0.32 text \beta
end key

set hei 0.6
amove xg(0.078) yg(0.170)
write "Phase \raise{-0.06em}{II}"
amove xg(0.061) yg(0.055)
write "Phase \raise{-0.06em}I"

set hei 0.4
amove xg(0.053) yg(0.175)
write "{\it L} || \sethei{0.35}d"

! Done. We have learned about clipping and color gradients.
curve.gle
curve.gle
size 18 27
set font pltr
amove 9.2 22
begin path fill blue
amove 9.2 22
bezier 10.05 22.05 11.15 20.6 11.6 19.6
bezier 12.05 18.6 10.45 18.5 11 18
bezier 11.55 17.5 14.45 17.9 13.8 17.6
bezier 13.15 17.3 9.9 16.5 8.4 16.8
closepath
end path
amove 4.6 23.4
circle 1.67092
amove 6 21.8
circle 1.33752 fill GREEN
amove 11.2 16.2
circle 1.32639 fill GREEN
amove 3.8 13.2
box 6.6 -2.2 fill GREEN
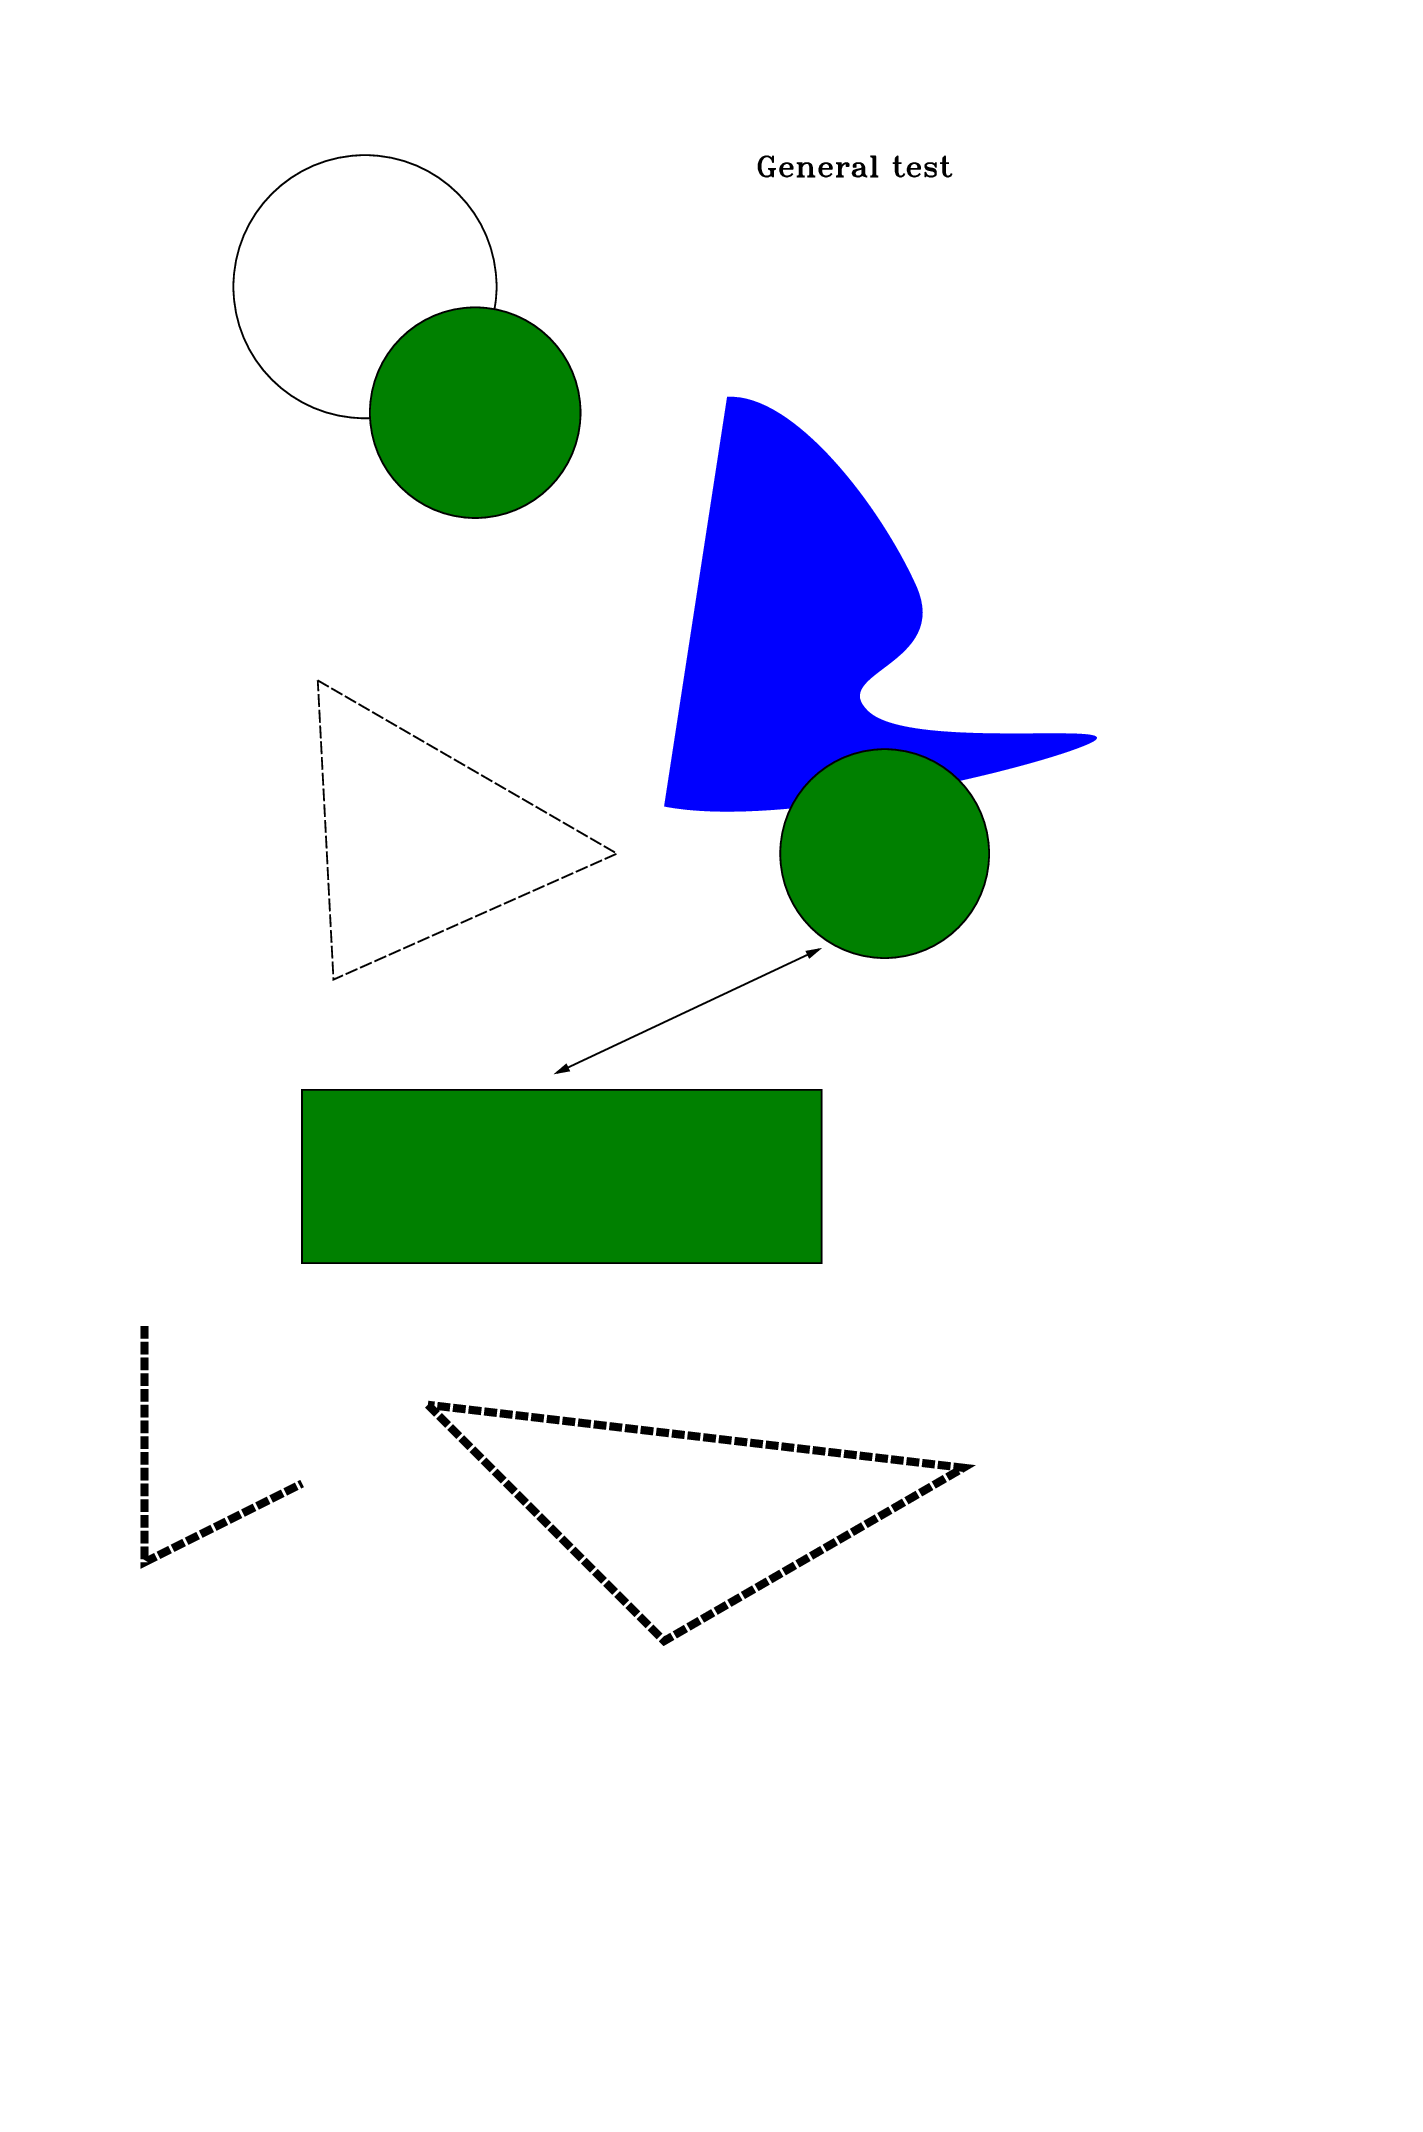
amove 9.6 24.8
text General test
amove 10.4 15
aline 7 13.4 arrow both
set lstyle 3
amove 4 18.4
rline 3.8 -2.2
rline -3.6 -1.6
closepath
set lwidth .1
amove 5.4 9.2
rline 3 -3
rline 3.8 2.2
closepath
amove 1.8 10.2
rline 0 -3
rline 2 1
flow.gle
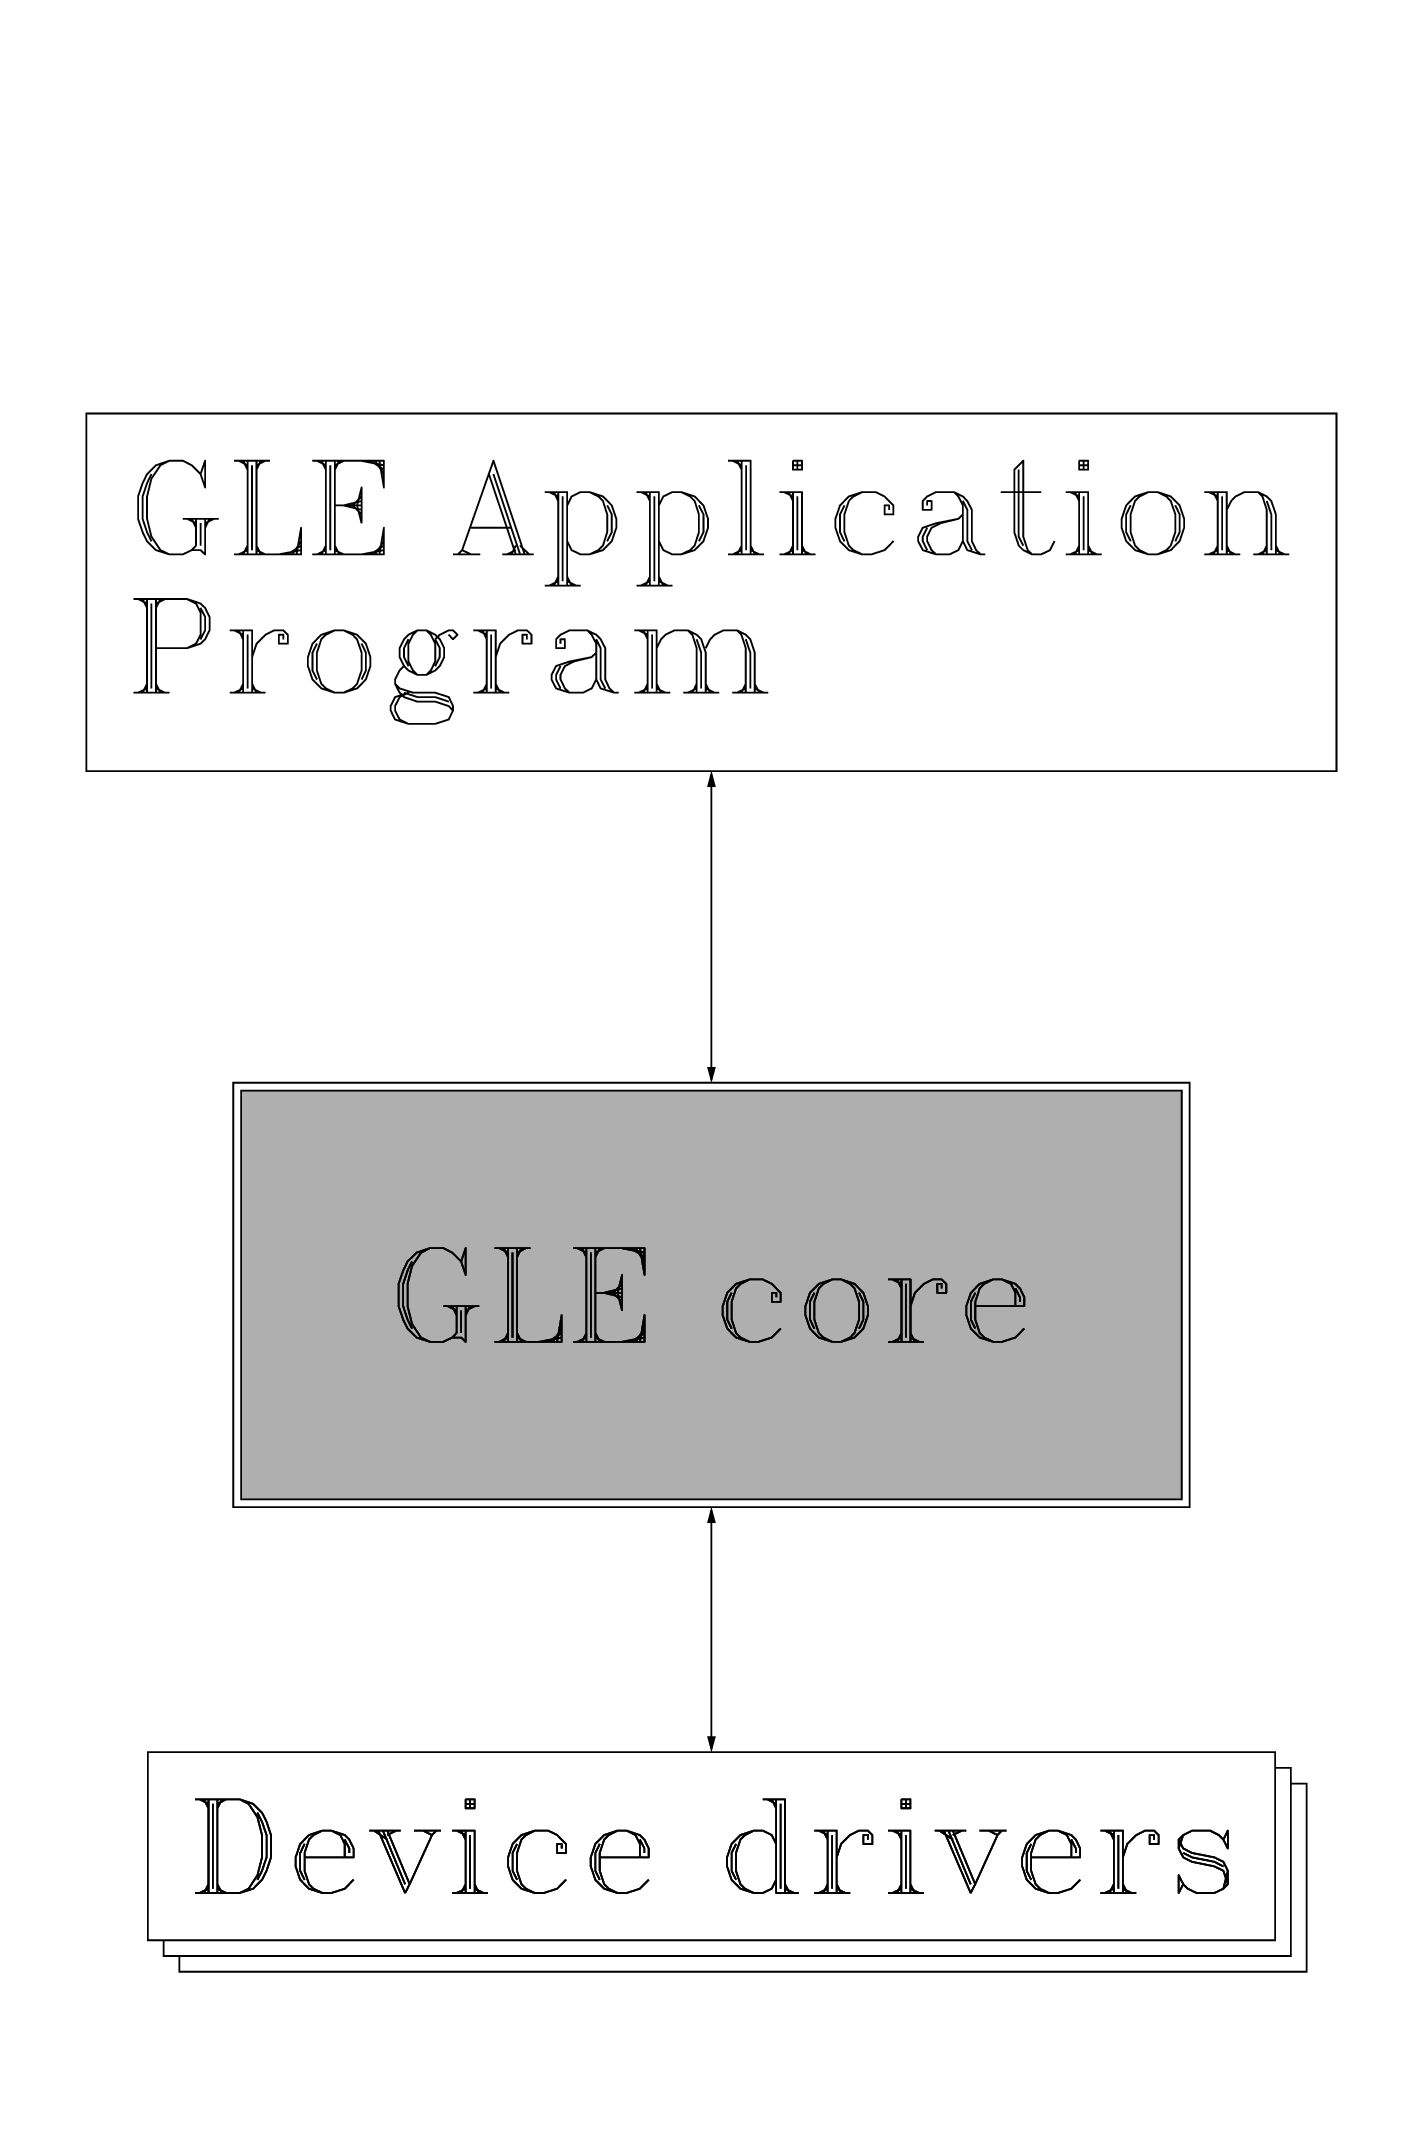
flow.gle
size 18 27

amove 9 20
set font pltr just center hei 1.7
begin box add .6 name a
begin text
GLE Application
Program
end text
end box

rmove 0 -10
begin box add 2 name b fill gray20
 text GLE core
end box
begin box add 2.1 name b
 text GLE core
end box
rmove 0 -7

rmove .4 -.4
begin box add .6 fill white
 text Device drivers
end box
rmove -.2 .2
begin box add .6 fill white
 text Device drivers
end box
rmove -.2 .2
begin box add .6 fill white name c
 text Device drivers
end box
text Device drivers

join a.bc <-> b.tc
join b.bc <-> c.tc
gc_color.gle
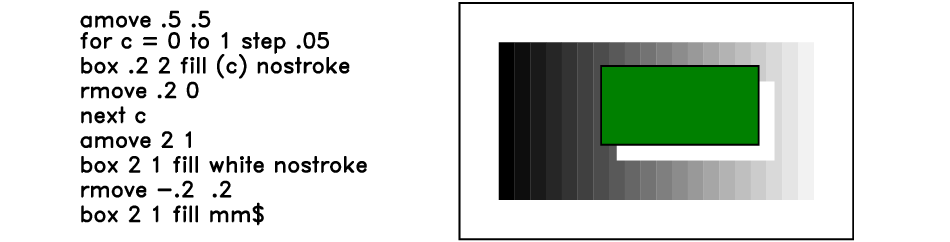
gc_color.gle
size 12 3
amove 1 2.7
set hei 0.27
set font pldr !tt
mm$ = "green"
begin table
  amove .5 .5
  for c = 0 to 1 step .05
    box .2 2 fill (c) nostroke
    rmove .2 0
  next c
  amove 2 1
  box 2 1 fill white nostroke
  rmove -.2  .2
  box 2 1 fill mm$
end table

amove 5.8 0
box 5 3
begin origin
  amove .5 .5
  for c = 0 to 1 step .05
    box .2 2 fill (c) nostroke
    rmove .2 0
  next c
  amove 2 1
  box 2 1 fill white nostroke
  rmove -.2  .2
  box 2 1 fill mm$
end origin
gc_join.gle

gc_join.gle
size 12 3
amove 1 2.7
set hei .27
set font pldr ! tt
begin table
    set hei .3 font plge
    amove 1.2 .2
    box 1 1 fill blue  name square
    amove 1.9 2
    begin box add .1  name titlebox
        text Title
    end box
    join square.tr -> titlebox.tr
    join square <- titlebox
    join square.tc <-> titlebox.v
end table

amove 7.4 0
box 4 3
begin origin
    set hei .6 font plge
    set hei .3
    amove 1.2 .2
    box 1 1 fill blue  name square
    amove 1.9 2
    begin box add .1  name titlebox
        text Title
    end box
    join square.tr -> titlebox.tr
    join square <- titlebox
    join square.tc <-> titlebox.v
end origin
gc_write.gle
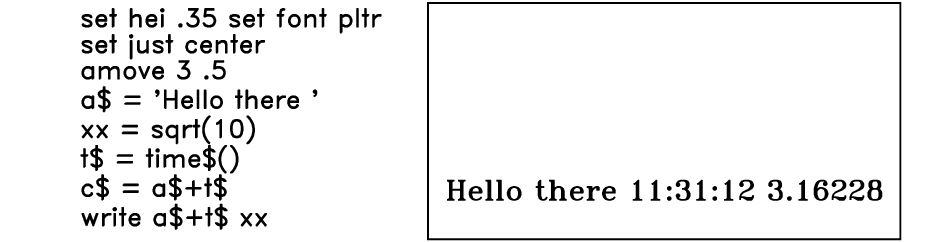
gc_write.gle
size 12 3
amove 1 2.7
set hei .32
set font pldr ! tt
begin table
  set hei .35 set font pltr
  set just center
  amove 3 .5
  a$ = "Hello there "
  xx = sqrt(10)
  t$ = time$()
  c$ = a$+t$
  write a$+t$ xx
end table

amove 5.4 0
box 6 3
begin origin
  set  hei .35  just center  font pltr
  amove 3 .5
  a$ = "Hello there "
  xx = sqrt(10)
  t$ = time$()
  c$ = a$+t$
  write a$+t$ xx
end origin
hello_world.gle

hello_world.gle
! 'Hello world' script.
! Author: Francois Tonneau

! In GLE scripts, lines that start with '!' are comments and are ignored by the
! compiler.

! Before trying to draw anything, we must define the width and height of the
! drawing area. Here we define it to be 10-cm wide, 4.5-cm high (GLE understands
! all units to be centimeters):

size 10 4.5

! We define line width to be 0.06 cm and the drawing color to be 'indianred',
! one of the colors known by name to GLE (the full list of names can be found
! in the User Manual):

set lwidth 0.06
set color indianred

! Now we move to a point of absolute coordinates ('amove') x = 1 cm, y = 1 cm
! and we draw a 8-cm wide, 2.2-cm high box. The box will have rounded corners
! with a corner radius of 0.3 cm:

amove 1 1
box 8 2.2 round 0.3

! For drawing text, we choose a sans-serif font ('ss': see the User Manual for
! a list of fonts) and a height of 1 cm. For more precise control over color,
! we specify it in the #RRGGBB format. Finally, we write 'Hello, World!' at
! position x = 2.25 cm, y = 1.75 cm:

set font ss
set hei 1
set color #004e58

amove 2.25 1.75
write "Hello, World!"

! ==========

! To create a PDF image from this script, save it in a folder of your choice,
! open a command prompt, go to your folder, and type 'gle -d pdf hello.gle'. If
! all goes well, GLE will compile the script into a hello.pdf file that can be
! opened and viewed like any other PDF document.

! The '-d' option is short for '-device' and tells GLE which type of output
! (eps, pdf, ...) you expect from script compilation. Type 'gle -help device'
! at the command prompt to see which output formats are available on your
! system. Type 'gle -help' for information about other GLE options.
loop.gle
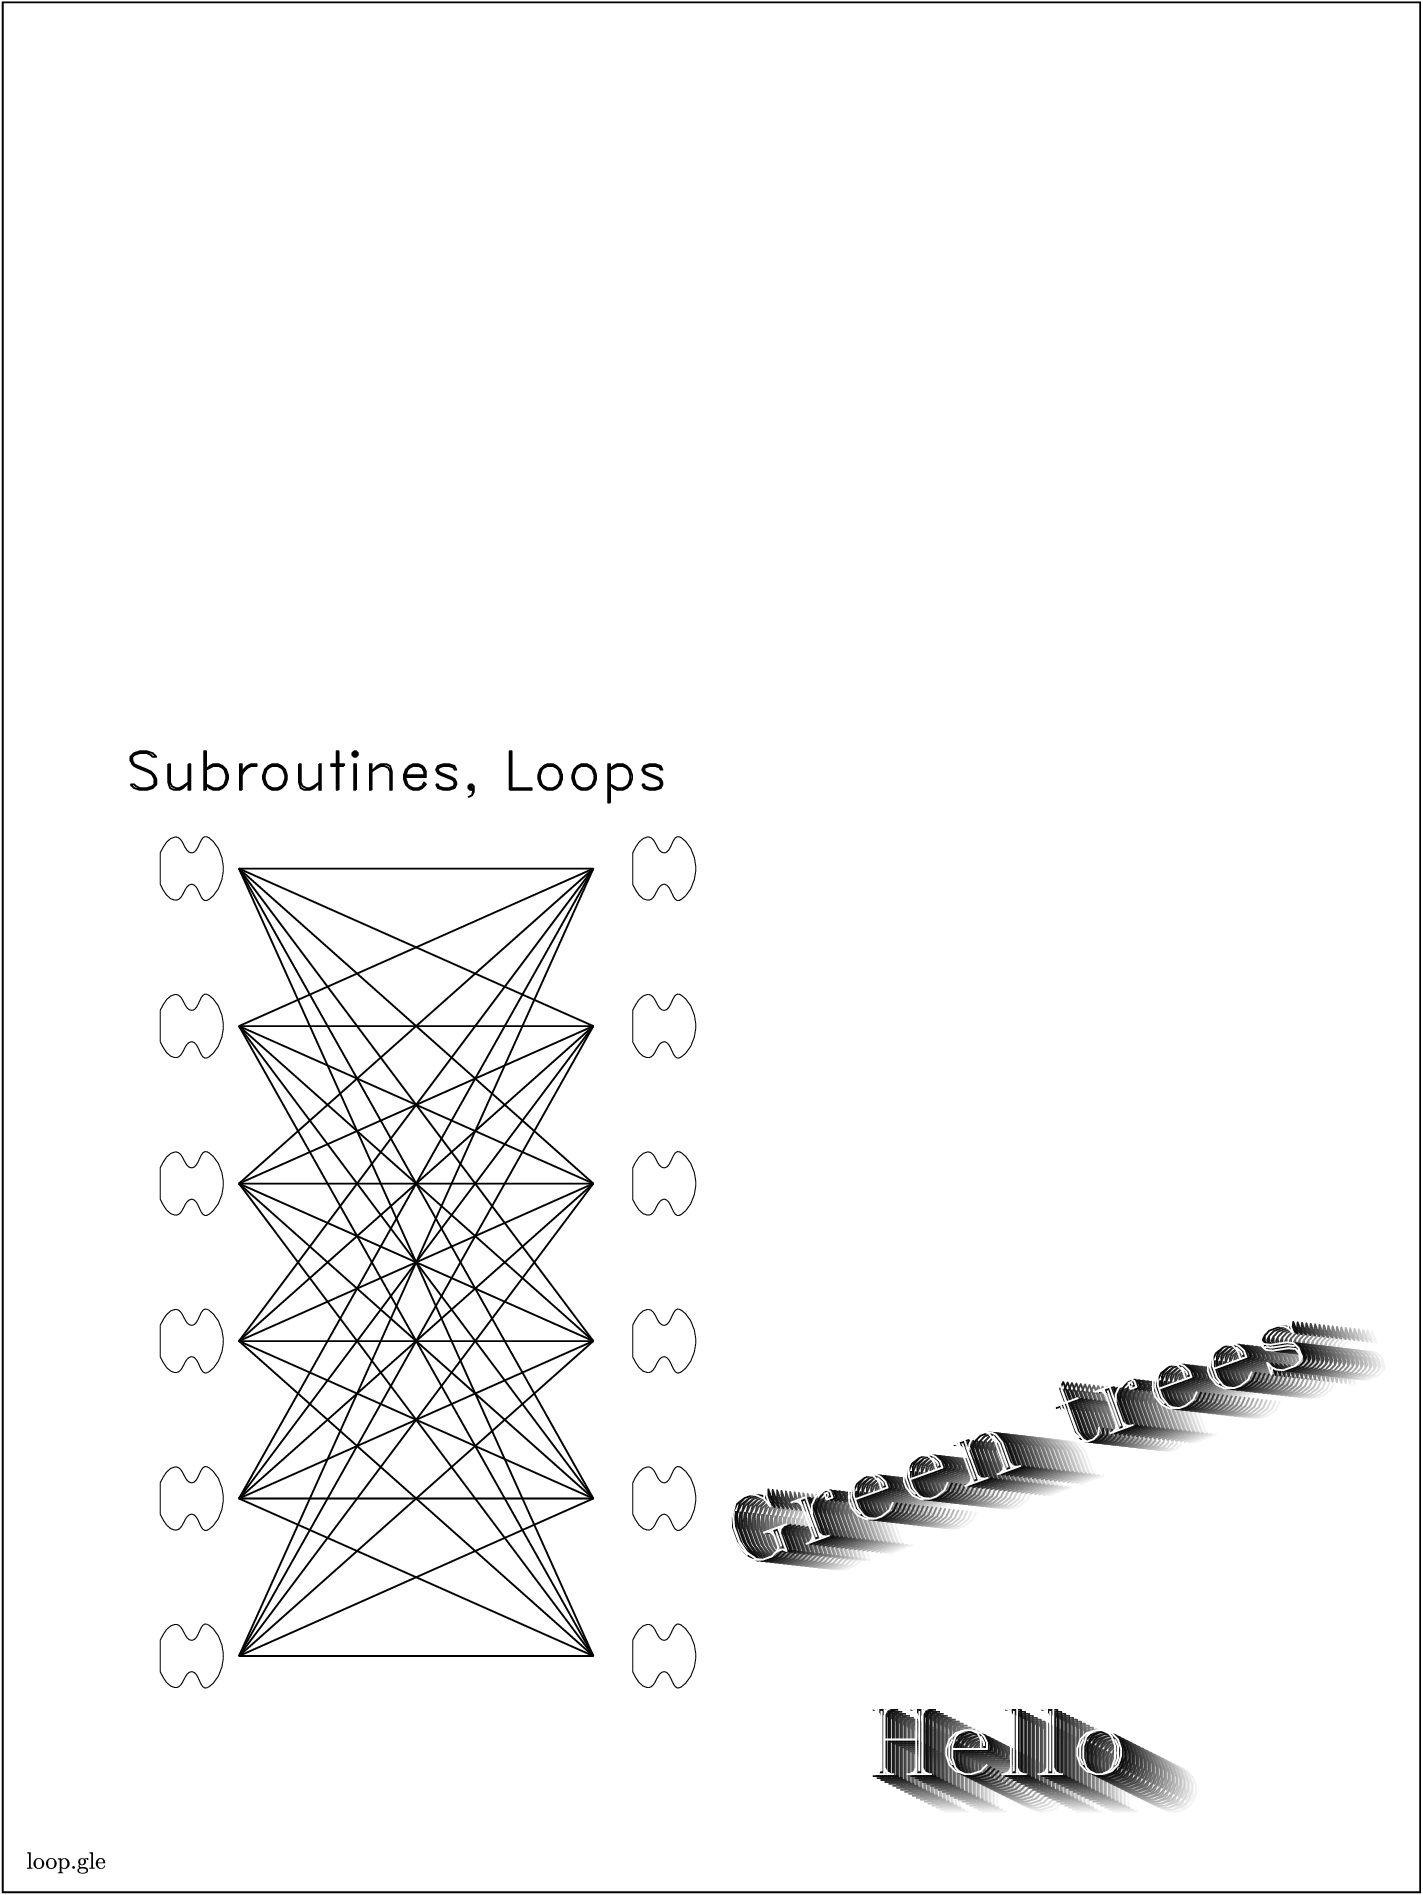
loop.gle
size 18 24 box      ! This is LOOP.GLE, shows programming examples
set hei .3
amove .3 .3
text loop.gle

amove 5 14
set just center hei 1
set font pldr hei 0.7
text Subroutines, Loops
set just left hei .7
set hei .9

! First define a single neuron
sub neuron xx yy
  amove xx yy
  begin scale .5 .5
    curve  0  .4  .4  .4  .4 -.4  .4  .4  .4 -.8 -.4 -.8 -.4 .4
    curve -.4 -.8 -.4  .4 -.4 -.4 -.4  .4  0  .4
    closepath
  end scale
end sub

! Draw the neurons
for xx = 0 to 1
  for i = 1 to 6
    @neuron xx*6+2 i*2+1.2
  next i
next xx

! Draw the lines between them
for i = 1 to 6
  for j = 1 to 6
    amove 3 i*2+1
    aline 7.5 j*2+1
  next j
next i

!--------------------------------------------------------------------------
include ziptext.gle
set font pltr hei 1.2
amove 12 1
@ziptext "Hello"
amove 10.5 4
begin rotate 20
@ziptext "Green trees"
end rotate
stairs.gle
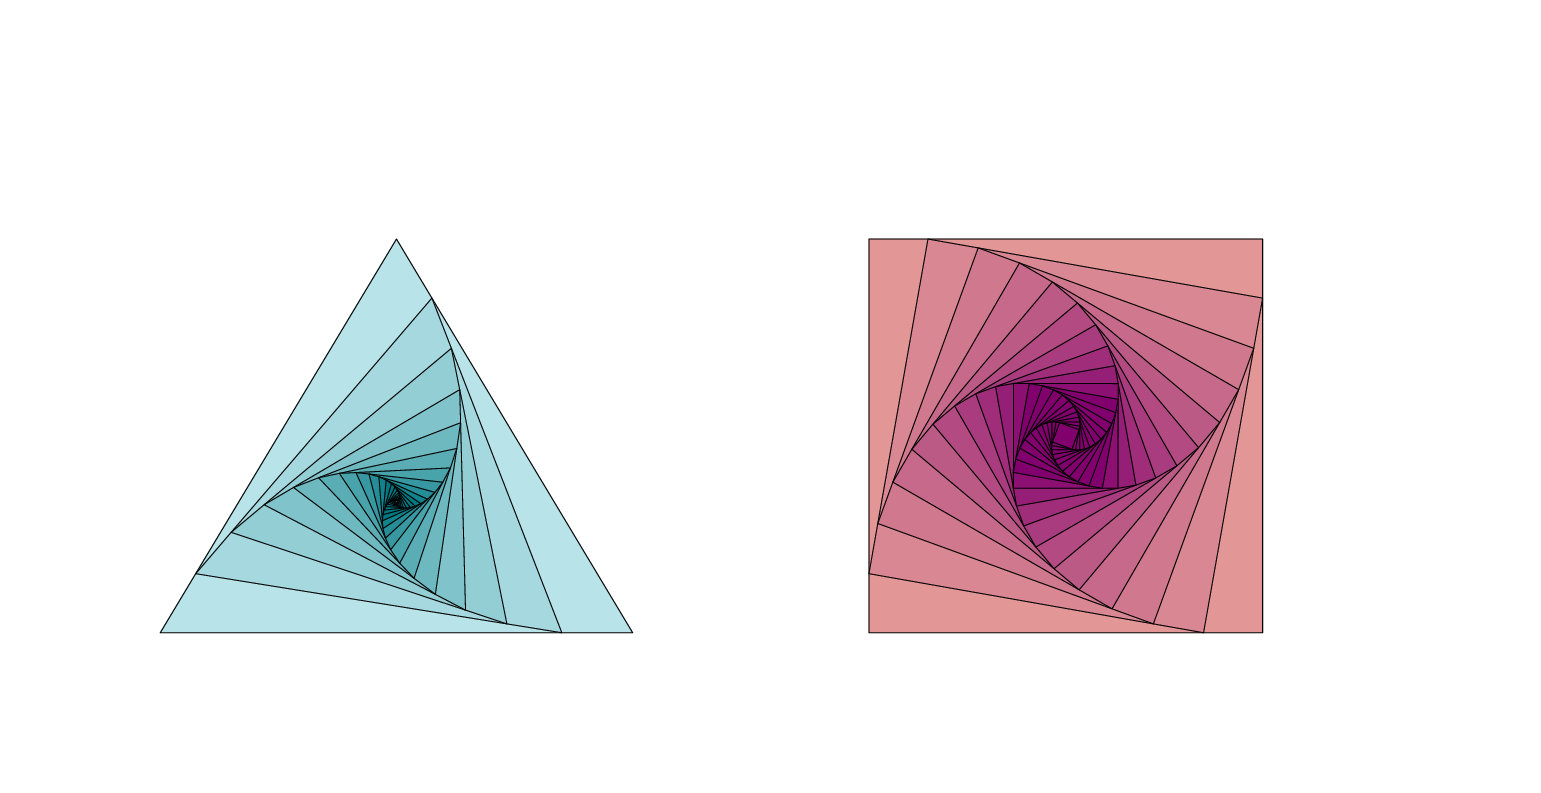
stairs.gle
! Figures drawn via vertex repositioning.
! Author: Francois Tonneau

! Plot idea from Alain Matthes:
! https://texample.net/rotated-triangle/

size 19.5 10

! ------------------------------
! Make drawing subroutines available.
! ------------------------------

declare sub def point$ x y
declare sub copy source$ destination$
declare sub fasten new$ refA$ refB$ proportion
declare sub drawcycle chain$
declare sub fillcycle chain$ hue$

declare sub bluemix z
declare sub redmix z

! ------------------------------
! Use subroutines in figure drawing.
! ------------------------------

set lwidth 0.01 join round cap round

! Define the initial vertices of an ABC triangle. Then loop to draw a series of
! triangles: at each step, copy a vertex to a temporary point X; then fasten new
! vertices along the AB, BC, and CX line segments.

def A 2 2
def B 5 7
def C 8 2

for stage = 0 to 20
    fillcycle ABC bluemix(stage/10)
    drawcycle ABC
    copy A X
    fasten A A B 0.15
    fasten B B C 0.15
    fasten C C X 0.15
next stage

! Use similar methods to draw a series of ABCD squares.

def A 11 2
def B 11 7
def C 16 7
def D 16 2

for stage = 0 to 20
    fillcycle ABCD redmix(stage/10)
    drawcycle ABCD
    copy A X
    fasten A A B 0.15
    fasten B B C 0.15
    fasten C C D 0.15
    fasten D D X 0.15
next stage

! ------------------------------
! Implement drawing subroutines
! ------------------------------

sub __Point$ id$
    return "unique_point_"+id$
end sub

sub def point$ x y
    gsave
    amove x y
    save __Point$(point$)
    grestore
end sub

sub copy source$ destination$
    gsave
    amove ptx(__Point$(source$)) pty(__Point$(source$))
    save __Point$(destination$)
    grestore
end sub

sub fasten new$ refA$ refB$ proportion
    local xA = ptx(__Point$(refA$))
    local yA = pty(__Point$(refA$))
    local xB = ptx(__Point$(refB$))
    local yB = pty(__Point$(refB$))
    local xcoord = xA + (xB - xA) * proportion
    local ycoord = yA + (yB - yA) * proportion
    def new$ xcoord ycoord
end sub

sub drawcycle chain$
    local first$ = seg$(chain$, 1, 1)
    local fullcycle$ = chain$+first$
    local end = len(fullcycle$)
    local id$, pos
    amove ptx(__Point$(first$)) pty(__Point$(first$))
    for pos = 2 to end
        id$ = seg$(fullcycle$, pos, pos)
        aline ptx(__Point$(id$)) pty(__Point$(id$))
    next pos
end sub

sub fillcycle chain$ hue$
    begin path fill hue$
        drawcycle chain$
    end path
end sub

sub bluemix z
    if z > 1 then z = 1
    local r_low =  183; local g_low =  227;  local b_low =  233
    local r_high =   0; local g_high = 120;  local b_high = 130
    local r = (1 - z) * r_low + z * r_high
    local g = (1 - z) * g_low + z * g_high
    local b = (1 - z) * b_low + z * b_high
    return rgb255(r, g, b)
end sub

sub redmix z
    if z > 1 then z = 1
    local r_low =  227; local g_low =  150;  local b_low =  150
    local r_high = 130; local g_high =   0;  local b_high = 110
    local r = (1 - z) * r_low + z * r_high
    local g = (1 - z) * g_low + z * g_high
    local b = (1 - z) * b_low + z * b_high
    return rgb255(r, g, b)
end sub
stuff.gle
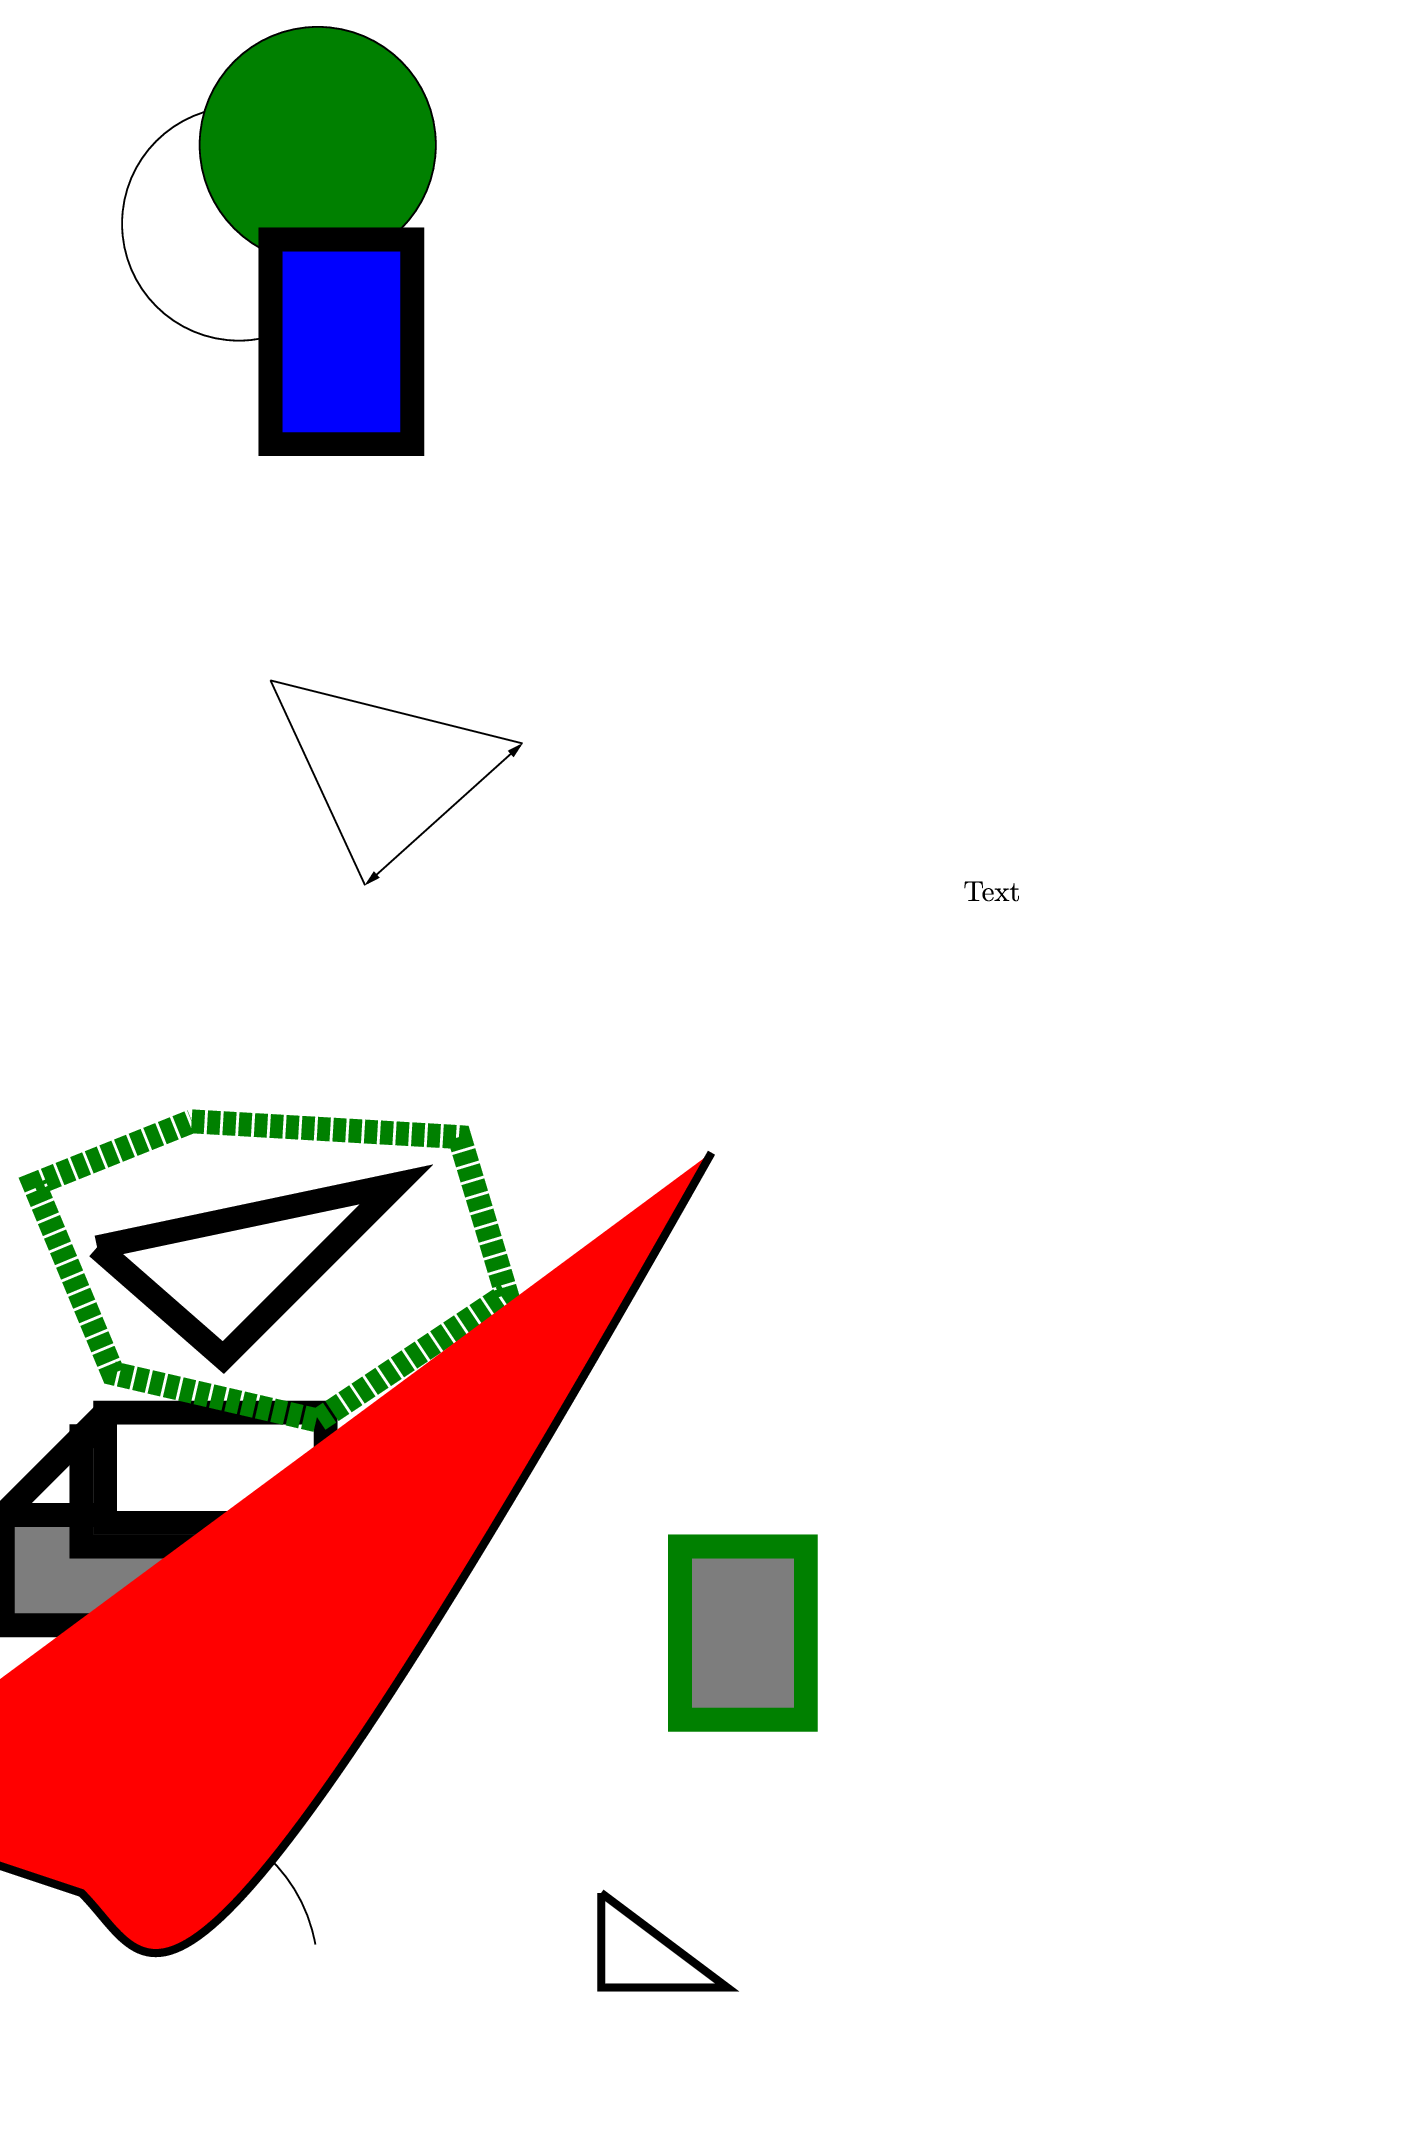
stuff.gle
size 18 27
amove 2 2
arc 2 10 95
amove  3  24.2
circle 1.48513
rline 1 1
circle 1.5 fill green
amove  3.4  18.4
rline  1.2 -2.6
aline  6.6  17.6  arrow both
rline -3.2  .799999
set lwidth .3
amove  1.2  11.2
rline  1.6 -1.4
rline  2.2  2.2
rline -3.8 -.8
amove  0  7.8
box  2.8 -1.4   fill gray40
rline 1 1
box  2.8 -1.4
rline .3 .3
box 2.8 -1.4 fill white
amove  3.4  24
box  1.8 -2.6   fill blue
amove  12.2  15.6
text Text
set color GREEN
amove  8.6  7.4
box  1.6 -2.2   fill gray40
set lstyle 3
amove  2.4  12.8
rline  3.4 -.2
rline  .6 -2
rline -2.4 -1.6
rline -2.6  .6
rline -1  2.4
rline  2  .8
set lstyle 1
begin path fill red
    amove  9  12.4
    bezier 2 0 2 2 1 3
    rline  -1.8  .6
    rline -.2 1.4
    closepath
end path

set lwidth .1
set color black
amove  9  12.4
bezier 2 0 2 2 1 3
rline  -1.8  .6
rline -.2 1.4

amove  7.6  3
rline  1.6 -1.2
rline -1.6  0
closepath
testaccents.gle
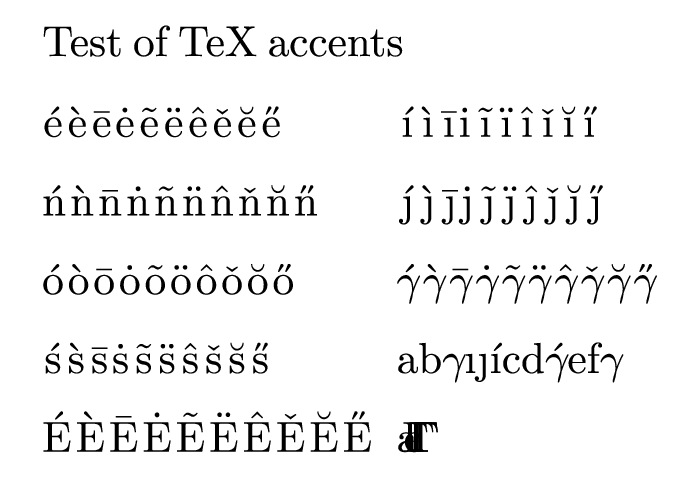
testaccents.gle
size 8.8 6

! Test of all possible accents

sub write_nxt ch$
   amove xend()+0.05 ypos()
   write ch$
end sub

sub print_all ch$
   write "\'"+ch$
   write_nxt "\`"+ch$
   write_nxt "\="+ch$
   write_nxt "\."+ch$
   write_nxt "\~"+ch$
   write_nxt "\''"+ch$
   write_nxt "\^"+ch$
   write_nxt "\v "+ch$
   write_nxt "\u "+ch$
   write_nxt "\H "+ch$
end sub

set just left hei 0.55 font texcmr

dy = 1; topy = 0.7

amove 0.5 pageheight()-theight("H")-0.3
write "Test of TeX accents"

amove 0.5 pageheight()-1*dy-topy
print_all "e"

amove 0.5 pageheight()-2*dy-topy
print_all "n"

amove 0.5 pageheight()-3*dy-topy
print_all "o"

amove 0.5 pageheight()-4*dy-topy
print_all "s"

amove 0.5 pageheight()-5*dy-topy
print_all "E"

amove 5 pageheight()-5*dy-topy
write "\k a\k e"

set font rm
amove xend()+0.05 yend()

write "\l\L"

set font texcmr

amove 5 pageheight()-1*dy-topy
print_all "\i"

amove 5 pageheight()-2*dy-topy
print_all "\j"

amove 5 pageheight()-3*dy-topy
print_all "\gamma"

amove 5 pageheight()-4*dy-topy
begin table
 ab\gamma \i\j\'\i cd\'\gamma ef\gamma
end table
ulam.gle
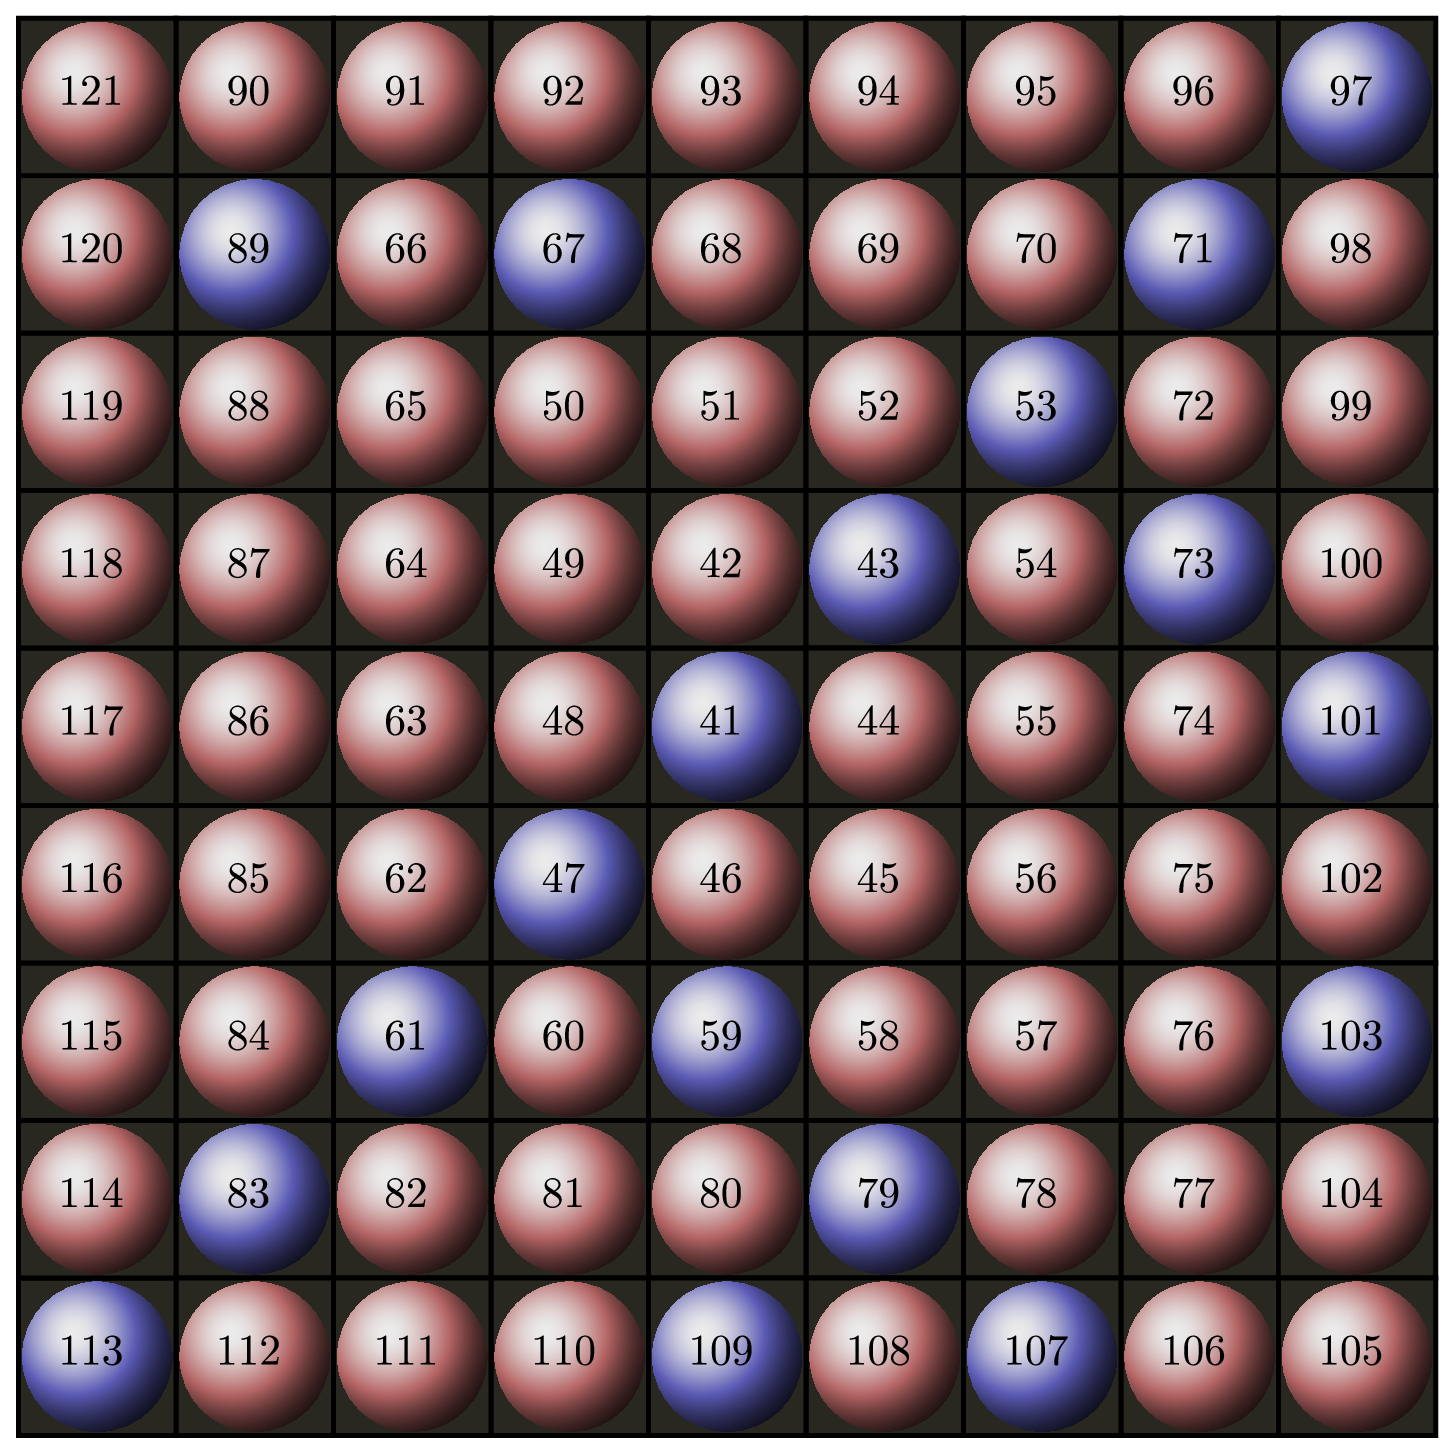
ulam.gle
! Example of Ulam spiral.
! Author: Francois Tonneau

! Plot idea from Alain Matthes:
! https://texample.net/ulam-spiral/

size 18.4 18.4

xpos = pagewidth()/2
ypos = pageheight()/2

unit = 2

numstart = 41
numstop  = 121

length = 1

declare sub run length direction$
declare sub paint number xpos ypos
declare sub primality number

declare sub lighting x y
declare sub blueish z
declare sub pinkish z

number = numstart
paint number xpos ypos

! ------------------------------
! Draw the spiral by successive turns.
! ------------------------------

while number <= 96
    ! Do one full turn.
    run length up
    run length right
    length = length + 1
    run length down
    run length left
    length = length + 1
next
! Add last ladder.
run length-1 up

sub run length direction$
    local dx, dy
    if direction$ = "up" then
        dx = 0; dy = unit
    else if direction$ = "right" then
        dx = unit; dy = 0
    else if direction$ = "down" then
        dx = 0; dy = -unit
    else if direction$ = "left" then
        dx = -unit; dy = 0
    end if
    local k
    for k = 1 to length
        number = number + 1
        xpos = xpos + dx
        ypos = ypos + dy
        paint number xpos ypos
    next k
end sub

sub paint number xpos ypos
    amove xpos ypos
    set color black lwidth 0.06
    box unit unit justify cc fill "#282820"
    gsave
    begin clip
        begin path clip
            circle (unit/2)-0.05        ! -0.05: => avoid biting on box borders
        end path
        rmove -unit/2 -unit/2
        if primality(number) = 1 then
            colormap "lighting(x,y)" -1 1 -1 1 100 100 unit unit palette blueish
        else
            colormap "lighting(x,y)" -1 1 -1 1 100 100 unit unit palette pinkish
        end if
    end clip
    grestore
    amove xpos-0.08 ypos+0.08           ! +-0.08: => improve apparent centering
    set just cc hei 0.55 color black
    write number
end sub

! ------------------------------
! Determine whether a number is prime
! ------------------------------

sub divides number factor
    local quotient = number/factor
    if int(quotient) = quotient then
        return 1
    else
        return 0
    end if
end sub

sub primality number
    ! This simple test works only for integers <= 121!
    if divides(number, 2)  = 1 then return 0
    if divides(number, 3)  = 1 then return 0
    if divides(number, 5)  = 1 then return 0
    if divides(number, 7)  = 1 then return 0
    if divides(number, 11) = 1 then return 0
    return 1
end sub

! ------------------------------
! Handle ball coloring
! ------------------------------

sub lighting x y
    local gloss = 8.5       ! gloss exponent
    local radius = 2.0      ! radius of a hypothetical x, y, z ball
    local rsquare = radius * radius
    if x * x + y * y > rsquare then return 0
    local z = sqrt(rsquare - x * x - y * y)
    local x_hot = -0.30; local y_hot =  0.30      ! position of brightest spot
    local z_hot = sqrt(rsquare - x_hot * x_hot - y_hot * y_hot)
    local dot_product  = x * x_hot + y * y_hot + z * z_hot
    local cosine = dot_product / rsquare
    if cosine < 0 then cosine = 0
    return cosine^gloss
end sub

sub tone r_base g_base b_base z
    local r_black =   0; local g_black =   0;  local b_black =   0
    local r_white = 235; local g_white = 235;  local b_white = 235
    local w, r, g, h
    if z < 0.50 then
        w = z / 0.50
        r = (1 - w) * r_black + w * r_base
        g = (1 - w) * g_black + w * g_base
        b = (1 - w) * b_black + w * b_base
    else
        w = (z - 0.50) / 0.50
        r = (1 - w) * r_base + w * r_white
        g = (1 - w) * g_base + w * g_white
        b = (1 - w) * b_base + w * b_white
    end if
    return rgb255(r, g, b)
end sub

sub blueish z
    return tone(90, 90, 180, z)
end sub

sub pinkish z
    return tone(180, 100, 100, z)
end sub
utitle.gle
utitle.gle
size 18 27

include "shape.gle"

box 18 27
amove .2 .2
box 18-.4 27-.4
set just center hei 1.4 font rmi
amove 12.1 23

for i = 0 to 1 step .05
   set color (1-i)
   write "Utilities"
   rmove -.05 .025
next i

set color white
write "Utilities"
set color black

set hei .8 just center
amove 11.8 21.6
write "Surface, Contour,"
rmove 0 -.9
write "Manip, Fitz, Letz, Fitls"
rmove 0 -1.2
set hei .6
write "Version 3.2"
set just left hei .401 font rm

begin object thetext
   begin text width 13
      \setstretch{.01}MANIP is a general purpose data entry and manipulation
      package.

      FITLS fits any equation with unknown constants to X,Y data.

      FITZ allows surfaces to be fitted to X,Y,Z data.

      LETZ allows a surface to be generated from an X,Y
      equation.

      Evenly spaced Z data can be plotted
      using SURFACE or a contour of the data
      can be plotted on a normal GLE graph using CONTOUR.
   end text
end object

amove pagewidth()/2 16
draw shadow_box.tc thetext 0.4 0.4

set hei 7 font rmi
amove 2 2
begin path clip stroke
   write "GLE"
end path

set lwidth .1
amove 2 1.8
for i = 0 to 40
   amove 2 2
   aline i 40-i
next i