Contour Plots
Plots of countour lines.
volcano.gle
 volcano.gle volcano.zip zip file contains all files for this figure.
volcano.gle
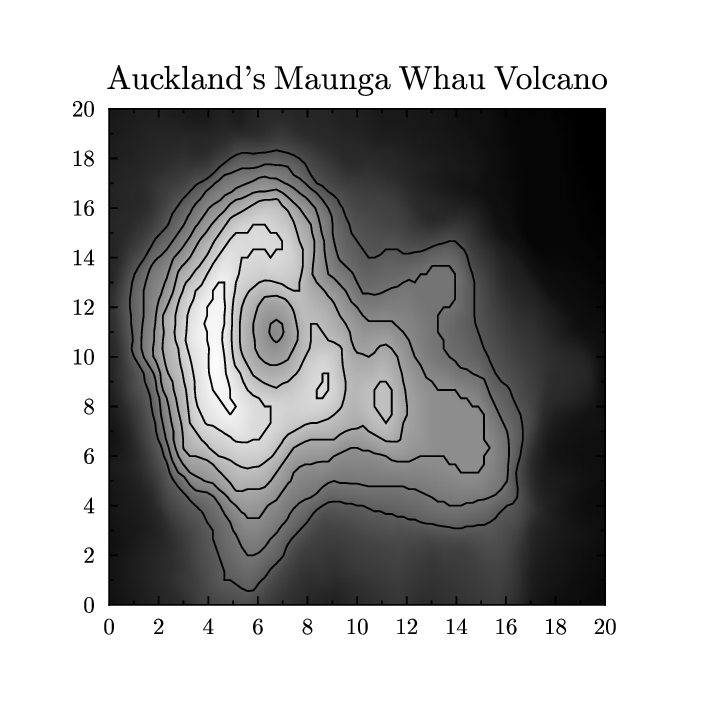
size 9 9

begin contour
   data "volcano.z"
   values from 130 to 190 step 10
end contour

begin graph
   title "Auckland's Maunga Whau Volcano"
   data "volcano-cdata.dat"
   d1 line color black
   colormap "volcano.z" 100 100
end graph
volcano.gle
 volcano.gle volcano.zip zip file contains all files for this figure.
volcano.gle
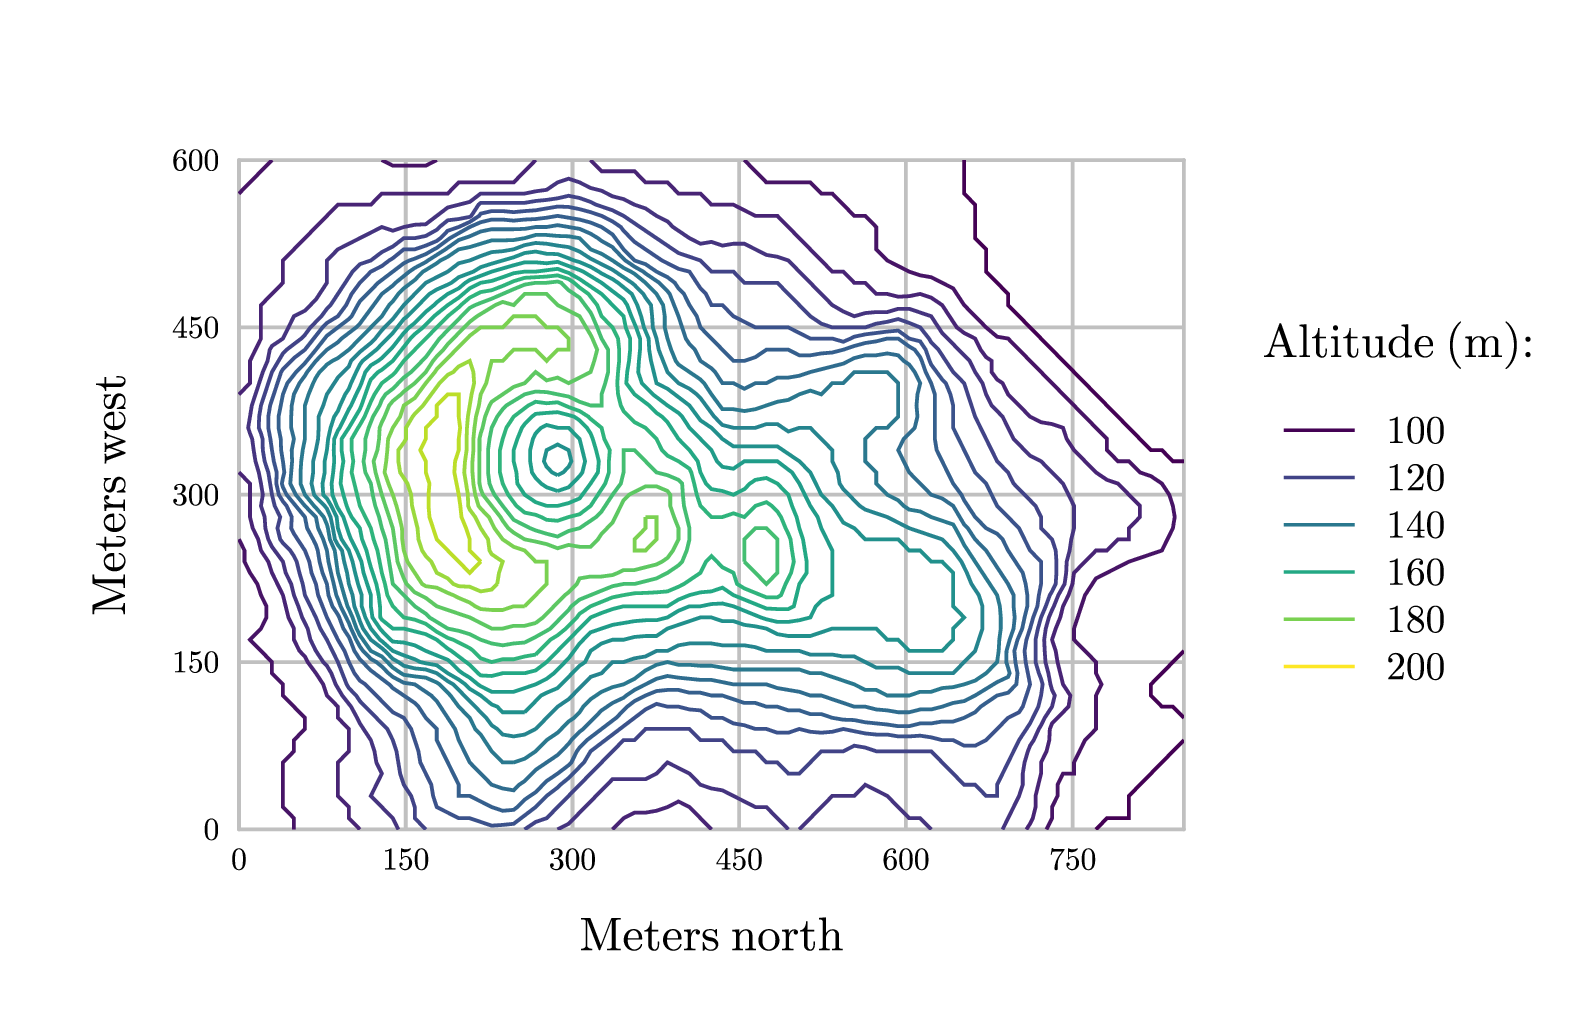
! Example of contour plot with colorized lines.
! Author: Francois Tonneau

size 20 13

include contourplus.gle
include palettes.gle

set font ss

begin contour
    data "volcano.z"
    values from 100 to 200 step 5
end contour

sub hue z
    local adjusted = (z - 100) / (200 - 100)
    return viridis(adjusted)
end sub

amove 3 2.5
begin graph
    size 12 8.5
    fullsize
    subticks off
    x2ticks  off
    y2ticks  off
    axis grid color #c0c0c0
    labels color black hei 0.5
    set lwidth 0.03
    xaxis min 0 max 850             ! '850': see the top line of volcano.z
    yaxis min 0 max 600             ! '600': see the top line of volcano.z
    xtitle "Meters north" dist 0.6 hei 0.6
    ytitle "Meters west" dist 0.6 hei 0.6
    axis dticks 150
    begin layer 1500
    set lwidth 0.045
    draw contourlines "volcano" "hue"
    end layer
end graph

amove 16 8.5
set hei 0.6
write "Altitude (m):"
begin key
    absolute 16 8 just tl nobox dist 0.4 hei 0.5
    for value = 100 to 200 step 20
        line color hue(value) lwidth 0.04 text num$(value)
    next value
end key