Three Dimensional Plots
Three dimensional plots and graphs.
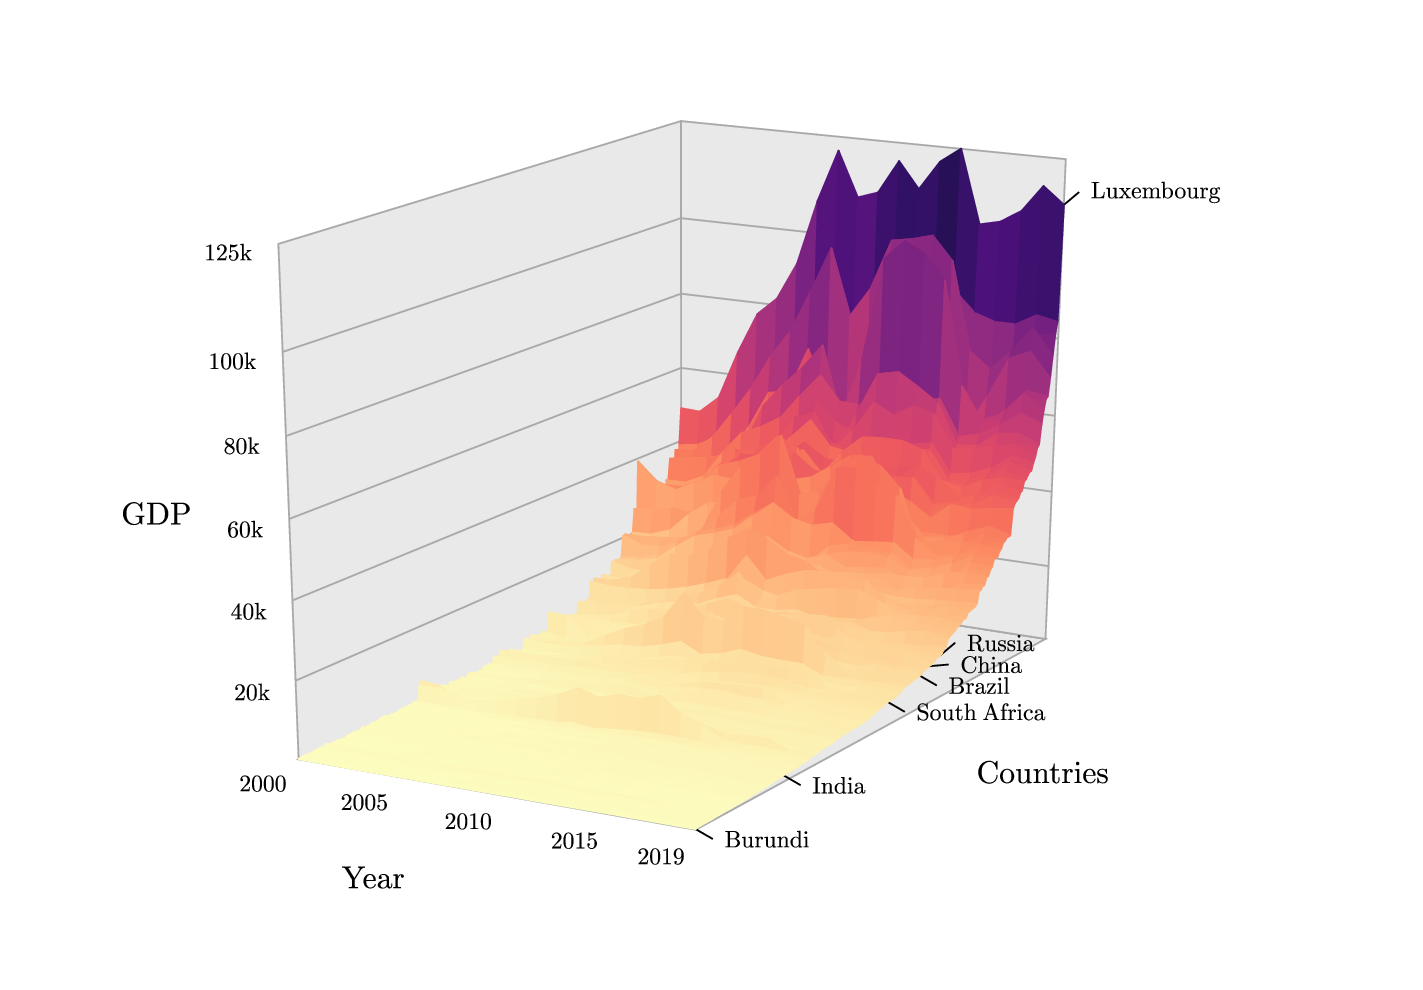
brics.gle
 brics.gle brics.zip zip file contains all files for this figure.
brics.gle
! Example of 3d surface plot.
! Author: Francois Tonneau

! Plot idea from https://www.andybeger.com/blog/3d-surface-plots/

include s3.gle
include palettes.gle

size 18 12.5

xrange 2000 2019
yrange 1 186
zrange 108 125200

scaling 0.6 1 1

angles 60 20
persp 0.80

viewport 10 9

! Draw plot panes.

amove 3.5 2

begin origin

set lwidth 0.02 color "#a9a9a9" fill "#e9e9e9"
pane B
pane I
grid zI 20000 110000 20000
pane J
grid zJ 20000 110000 20000

! Add axis labels and titles.

set color black font ss hei 0.3
set just cc
for num = 2000 to 2015 step 5
    label XB num 0.5 num 0 -0.1
next num
label XB 2019 0.5 2019 0 -0.1
set just cr
for num = 20000 to 110000 step 20000
    label JX num 0.35 (num/1000)+"k"
next num
label JX 125200 0.35 "125k"

set hei 0.4
label XB 2010 2.3 Year 0.8
label JX 70000 1.3 GDP
label YB 90 3.0 Countries

! Add a few country labels.

sub pin rank last_gdp country$ angle
    default angle 0
    local dist = 0.25
    s3move 2019 rank last_gdp
    rline dist*cos(torad(angle)) dist*sin(torad(angle))
    rmove 0.15 0
    write country$
end sub

set hei 0.3 just lc
pin 1 261 Burundi -30

pin 113 9011   Brazil -30
pin 124 11465  Russia 40
pin 43  2050   India -30
pin 118 10170  China 5
pin 96  6583  "South Africa" -30
pin 186 113860 Luxembourg 40

! Define palette.

sub hue z
    local a = 1 / (s3_zmin - s3_zmax)
    local b = -a * s3_zmax
    return magma(a * z + b)
end sub

! Draw surface.

set lwidth 0.02
s3datasurf formatted.dat hue same
!                facet --^   ^-- facet borders

end origin
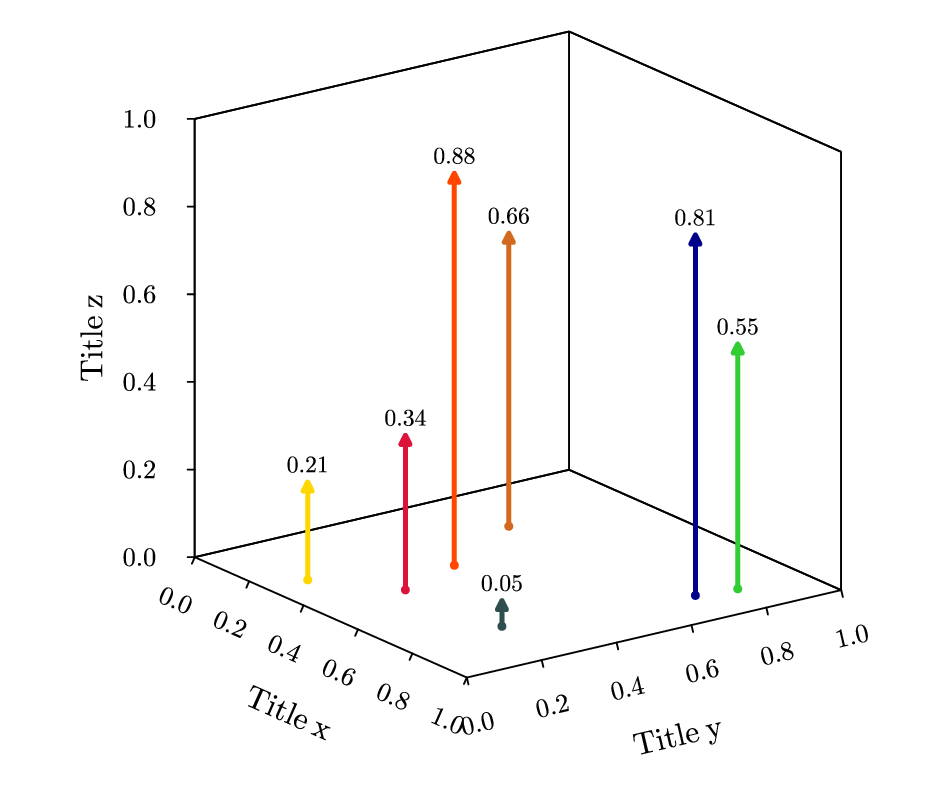
color-markers-3d.gle
 color-markers-3d.gle color-markers-3d.zip zip file contains all files for this figure.
color-markers-3d.gle
size 12 10

sub draw_colored_markers_3d data$ marker$
   gsave
   set lstyle 1 lwidth 0.06 just center hei 0.3
   fopen data$ file read
   until feof(file)
      fread file x y z red green blue
      set color rgb255(red,green,blue)
      amove xg3d(x,y,0) yg3d(x,y,0)
      circle 0.025 fill rgb255(red,green,blue)
      aline xg3d(x,y,z) yg3d(x,y,z)
      marker marker$ 0.55
      set color black
      rmove 0 0.2
      write format$(z,"fix 2")
   next
   fclose file
   grestore
end sub

begin object graph
   begin surface
      size 20 10
      cube xlen 20 ylen 20 zlen 10
      xaxis min 0 max 1 dticks 0.2 ticklen 0.09
      yaxis min 0 max 1 dticks 0.2 ticklen 0.09
      zaxis min 0 max 1 dticks 0.2 ticklen 0.09
      xtitle "Title x" hei 0.4
      ytitle "Title y" hei 0.4
      ztitle "Title z" hei 0.4
   end surface
   draw_colored_markers_3d "xyz.csv" ftriangle
end object

amove pagewidth()/2 pageheight()/2
draw graph.cc
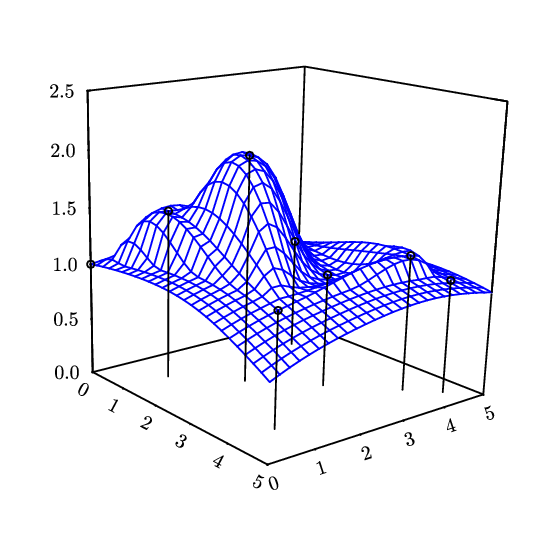
fitz.gle
 fitz.gle fitz.zip zip file contains all files for this figure.
fitz.gle
size 7 7

set font texcmr

begin fitz
   data "fitz.dat"
   x from 0 to 5 step 0.2
   y from 0 to 5 step 0.2
   ncontour 6
end fitz

begin object fitz
   begin surface
      size 8 8
      data "fitz.z"
      top color blue
      xaxis min 0 max 5 step 1 hei .25
      yaxis min 0 max 5 step 1 hei .25
      zaxis step .5 hei .25
      zaxis min 0 max 2.5
      points "fitz.dat"
      droplines lstyle 1
      marker circle
      view 2.5 3 .3
   end surface
end object

amove pagewidth()/2 pageheight()/2
draw fitz.cc
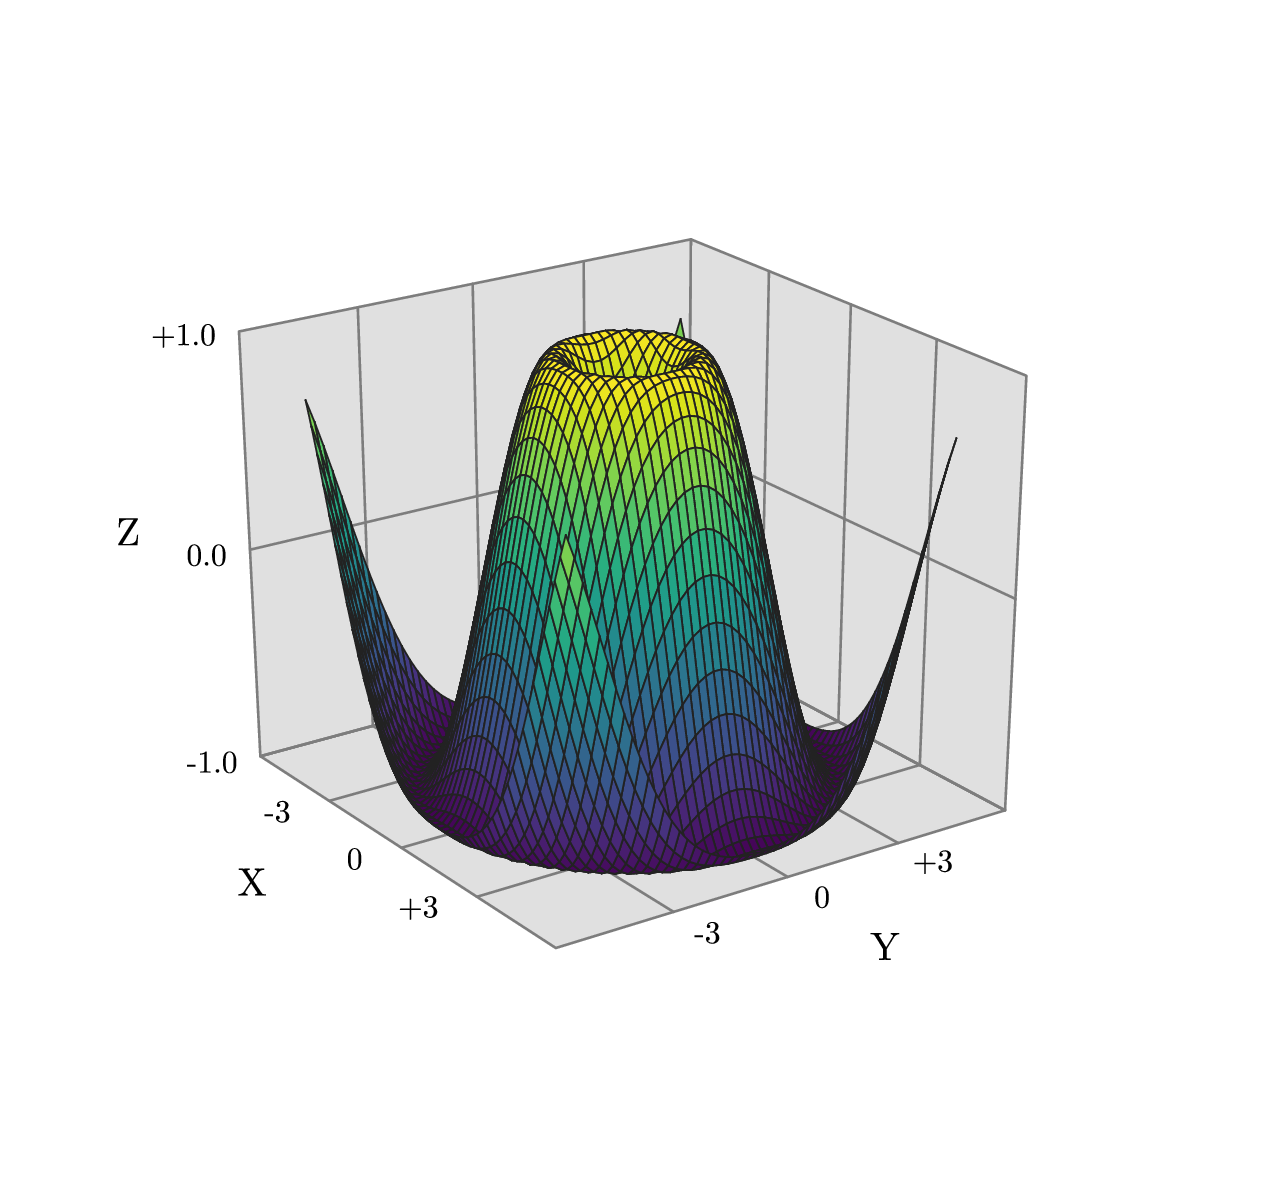
hat.gle
hat.gle
! Example of 3d surface plot.
! Author: Francois Tonneau

include s3.gle
include palettes.gle

size 16 15

xrange -5 5
yrange -5 5
zrange -1 1

xaxisrange -6 6
yaxisrange -6 6

angles 35 25
persp 0.80

viewport 10 9

amove 3 3

set cap round join round

begin origin

! Draw plot panes.

set lwidth 0.03 color gray40 fill "#e0e0e0"
pane B
grid xB -3 3 3
grid yB -3 3 3
pane I
grid xI -3 3 3
grid zI -1 0 1
pane J
grid yJ -3 3 3
grid zJ -1 0 1

! Add axis labels.

set color black font ss hei 0.4
set just cr
label XB -3 0.5 "-3"
label XB  0 0.5   0
label XB  3 0.5 "+3"
set just cc
label YB -3 0.5 "-3"
label YB  0 0.5   0
label YB  3 0.5 "+3"
set just rc
label JX -1 0.3 "-1.0"
label JX  0 0.3 " 0.0"
label JX  1 0.3 "+1.0"

! Add axis titles.

set hei 0.5
label XB -0.2 1.7 "X"
label YB -0.1 1.7 "Y"
label JX  0.2 1.4 "Z"

! Proceed to plot.

sub hat x y
    return sin(sqrt(x*x + y*y))
end sub

sub fillpalette z
    return viridis((z + 1)/2)
end sub

sub linepalette z
    return "#222222"
end sub

set lwidth 0.02
s3funcsurf hat fillpalette linepalette 50 50

end origin
lorenz.gle
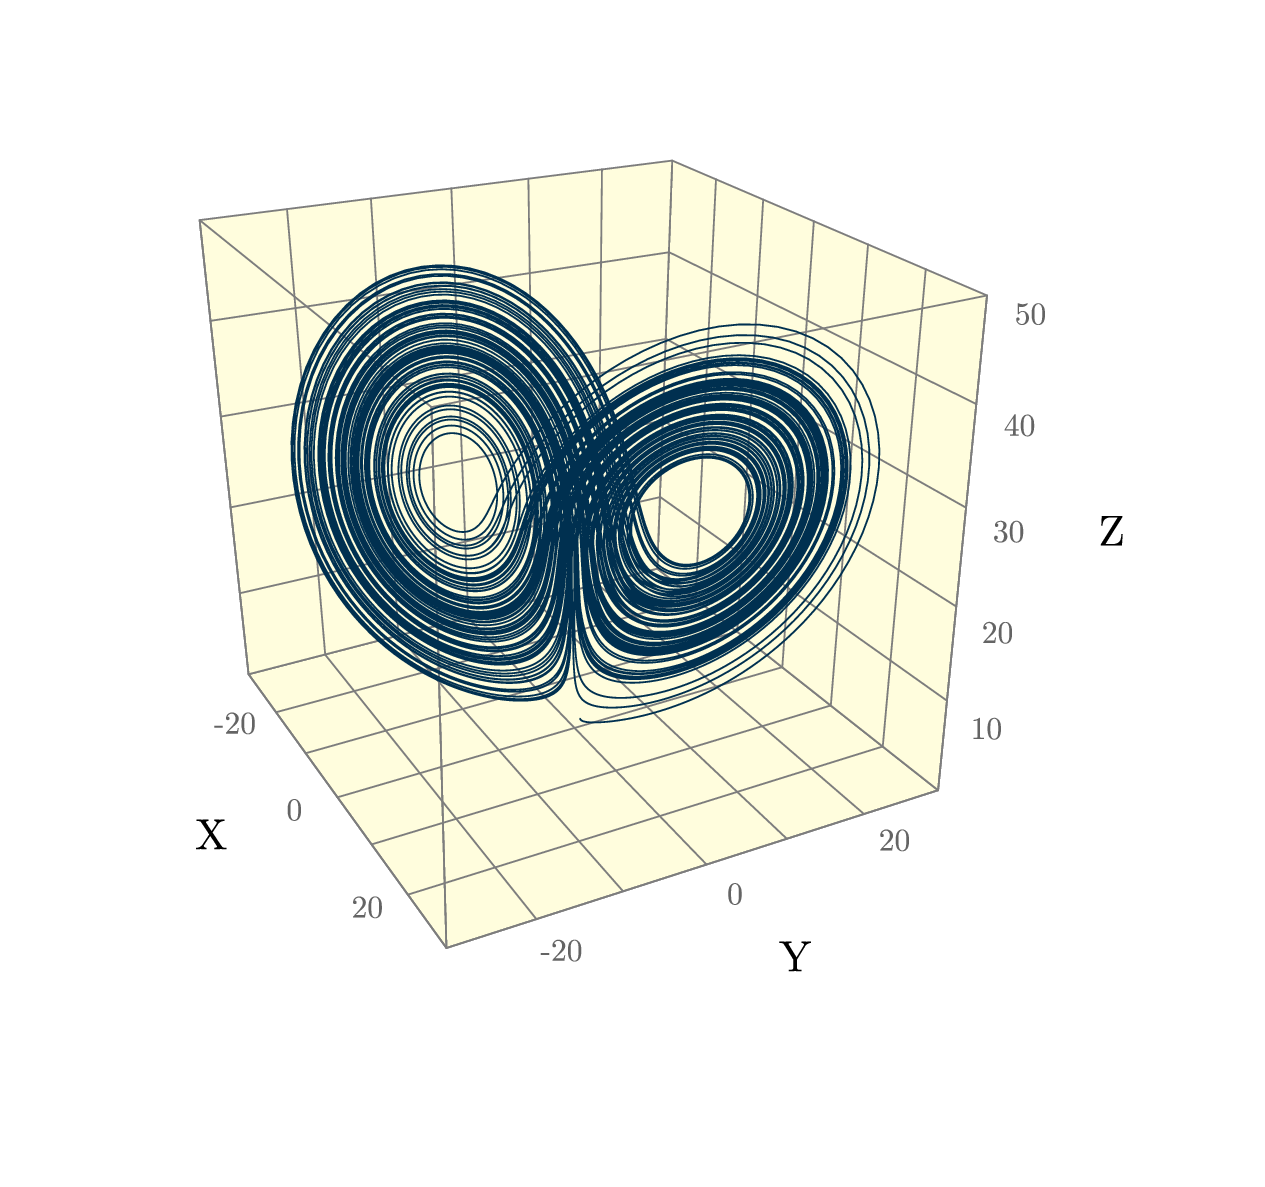
lorenz.gle
! Plot of the Lorenz attractor.
! Author: Francois Tonneau

include s3.gle

size 16 15

xrange -30 30
yrange -30 30
zrange 0 50

angles 28 26
persp 0.60

viewport 10 10

amove 2.5 3

set cap round join round

begin origin

! Draw plot panes.

set lwidth 0.02 color gray40 fill "#fffddd"
pane "B"
grid xB -20 20 10
grid yB -20 20 10
pane "I"
grid xI -20 20 10
grid zI  10 40 10
pane "J"
grid yJ -20 20 10
grid zJ  10 40 10
set fill clear
pane "X"
pane "Y"

! Add axis labels.

set font ss hei 0.4 color gray50
set just cc
label XB -20 0.5 -20
label XB   0 0.5   0
label XB  20 0.5  20

label YB -20 0.5 -20
label YB   0 0.5   0
label YB  20 0.5  20

for num = 10 to 50 step 10
    label YI num 0.6 num
next num

! Add axis titles.

set hei 0.55 color black
label XB  0 1.6 "X"
label YB  0 1.6 "Y"
label YI 35 2.0 "Z"

! Draw the attractor.

sub lorenz_xdot x y z
    xdot = lorenz_sigma * (y - x)
    return xdot
end sub

sub lorenz_ydot x y z
    ydot = (lorenz_rho * x) - y - (x * z)
    return ydot
end sub

sub lorenz_zdot x y z
    zdot = (x * y) - (lorenz_beta * z)
    return zdot
end sub

lorenz_sigma = 10
lorenz_rho = 27
lorenz_beta  = 3.50

dt = 0.005
ntimes = 25 * 1000

x = 0.0
y = 1.0
z = 1.05

s3move x y z

set color "#003050"

for time = 1 to ntimes
    x_new = x + dt * lorenz_xdot(x, y, z)
    y_new = y + dt * lorenz_ydot(x, y, z)
    z_new = z + dt * lorenz_zdot(x, y, z)
    s3line x_new y_new z_new
    x = x_new
    y = y_new
    z = z_new
next time

end origin
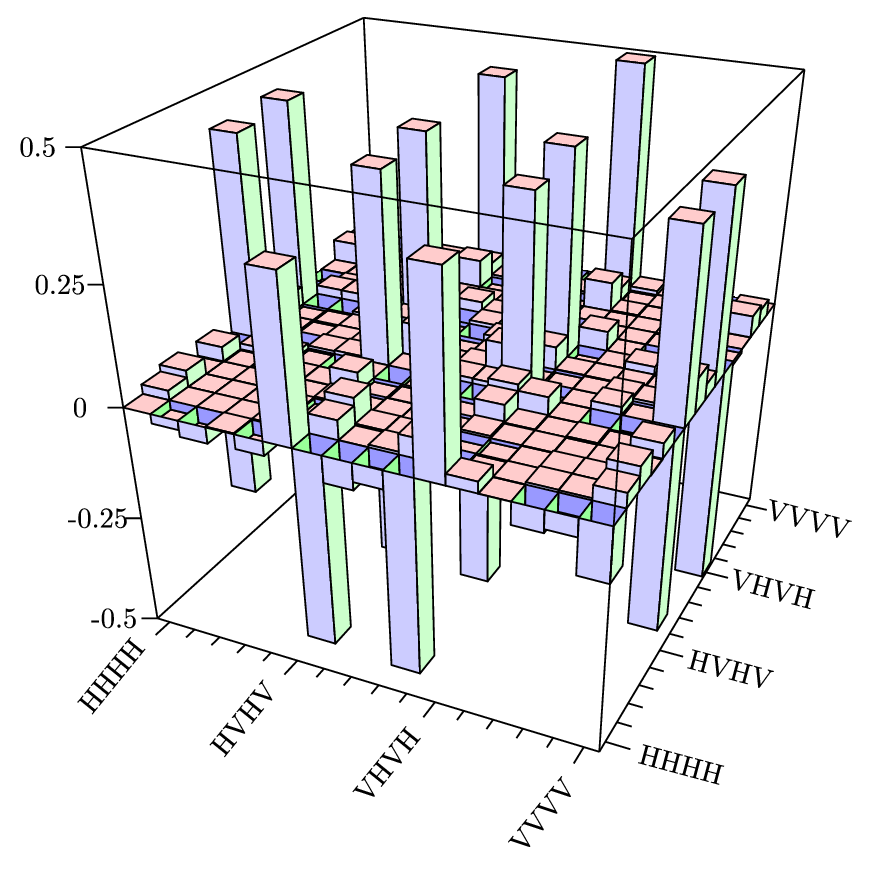
M16.gle
 M16.gle M16.zip zip file contains all files for this figure.
M16.gle
! Example by Jan Soubusta

size 11 11

mmax = 16   ! size of the matrix

alfa = 25   ! rotation of the cube in horizontal direction
beta = 35   ! rotation of the cube in vertical direction

z_axis_min  = -.5
z_axis_max  = 0.5
persp_scale = 3      ! perspective scale

include "matrix_3D.gle"

z0 = normalize_z(0)  ! origin of z-axis at 0

! compute position of the perspective point of infinity (xgrp, ygrp)
project_3D2D 0.5 0.5 0.5
xgrp = xgr+0; ygrp = ygr-3

begin object graph

   ! draw the graph based on data matrix in "xim03.dat"
   draw_bar_graph_3d "xim03.dat"

   ! draw the axis ticks
   draw_z_ticks z_axis_min z_axis_max .25
   draw_xy_ticks2 5

   ! draw the x-axis tick labels
   label_x 1  "HHHH"
   label_x 6  "HVHV"
   label_x 11 "VHVH"
   label_x 16 "VVVV"

   ! draw the y-axis tick labels
   label_y 1  "HHHH"
   label_y 6  "HVHV"
   label_y 11 "VHVH"
   label_y 16 "VVVV"

end object

! center the graph on the page
amove pagewidth()/2 pageheight()/2
draw graph.cc
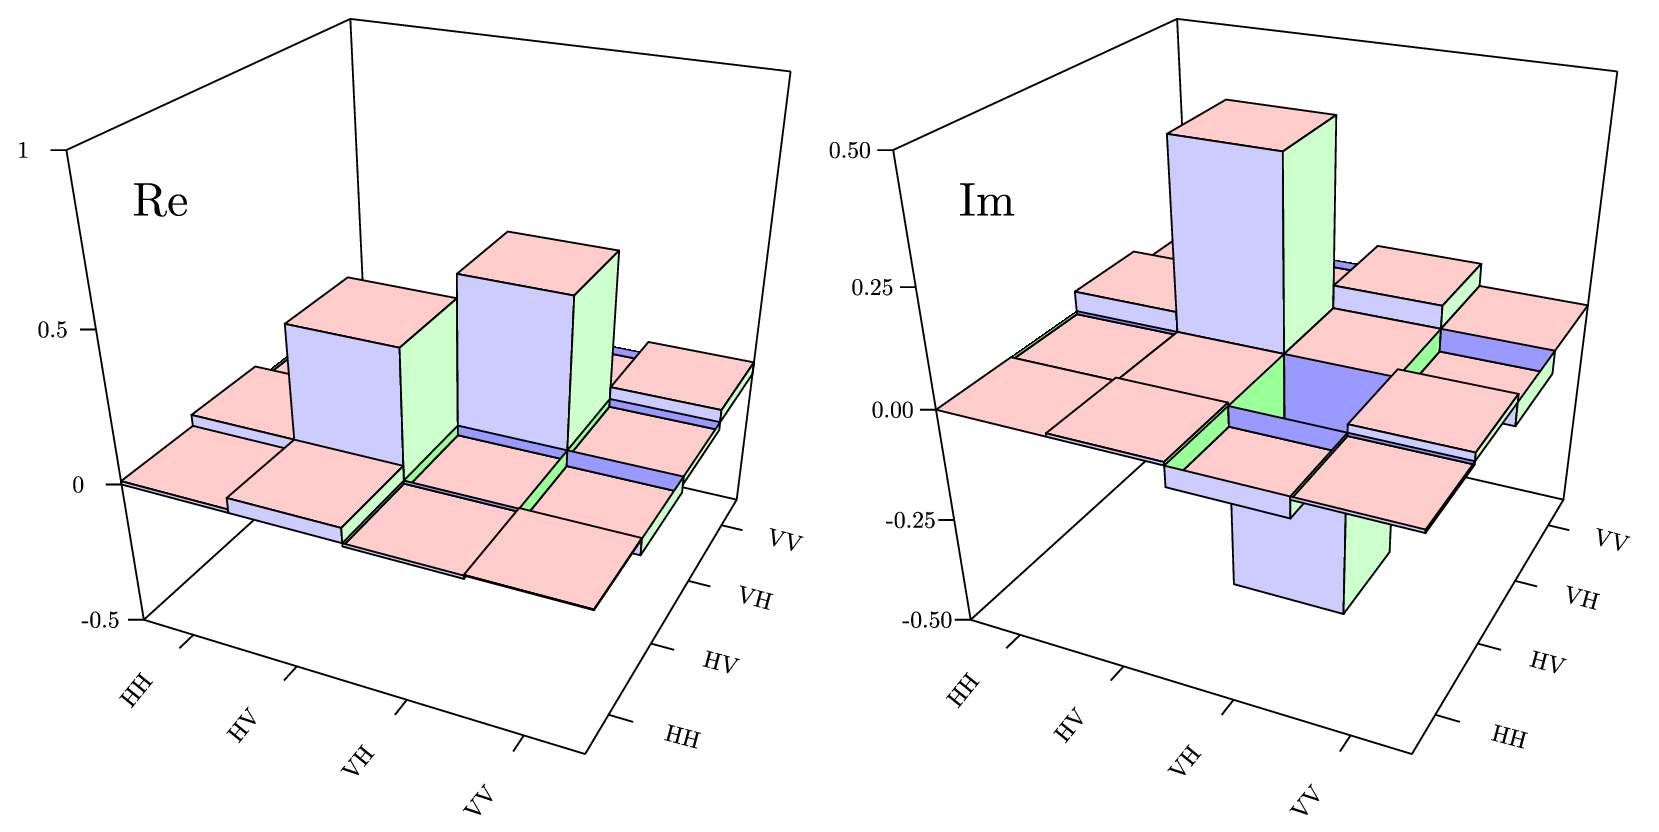
M4_Re_Im.gle
 M4_Re_Im.gle M4_Re_Im.zip zip file contains all files for this figure.
M4_Re_Im.gle
! Example by Jan Soubusta

size 21 10.5

alfa = 25
beta = 35
mmax = 4

persp_scale = 3

include "matrix_3D.gle"

sub namaluj_graf jmeno$ skip_lines polabel_xy popisz$
   begin origin
      if (popisz$="re") then
         z_axis_min = -.5
         z_axis_max  =  1
      else
         z_axis_min = -.5
         z_axis_max  = 0.5
         formatz$="fix 2"
      end if
      dmin = z_axis_min
      dmax = z_axis_max
      z0=normalize_z(0)

      draw_back_frame

      fopen jmeno$ vstup read
      local k
      for k=1 to skip_lines
         freadln vstup
      next k
      for k=1 to mmax
         draw_matrix_row k 1
      next k
      fclose vstup

      draw_middle_frame

      if (popisz$="re") then
         draw_z_ticks -.5 1 .5
      else
         draw_z_ticks -.5 .5 .25
      end if

      draw_xy_ticks

      if polabel_xy then
         label_x 1 "HH"
         label_x 2 "HV"
         label_x 3 "VH"
         label_x 4 "VV"

         label_y 1 "HH"
         label_y 2 "HV"
         label_y 3 "VH"
         label_y 4 "VV"
      end if
   end origin
end sub

sub print_xy x y txt$
   amove x y
   write txt$
end sub

!-----------------------------------------------------------

set just cc hei 0.3 color black
x0=0; y0=0
project_3D2D .5 .5 .5
x0 = pagewidth()/2-xgr-4.6
y0 = pageheight()/2-ygr+.8

project_3D2D .5 .5 .5
xgrp = xgr+0
ygrp = ygr-3

!-----------------------------------------------------------

filek$ = "sample_3D.dat"
amove 0 0
namaluj_graf filek$ 1 true "re"

amove 10.5 0
namaluj_graf filek$ 6 true "im"

set just cc hei .6 color black
kam = 8
print_xy 2    kam "Re"
print_xy 12.5 kam "Im"
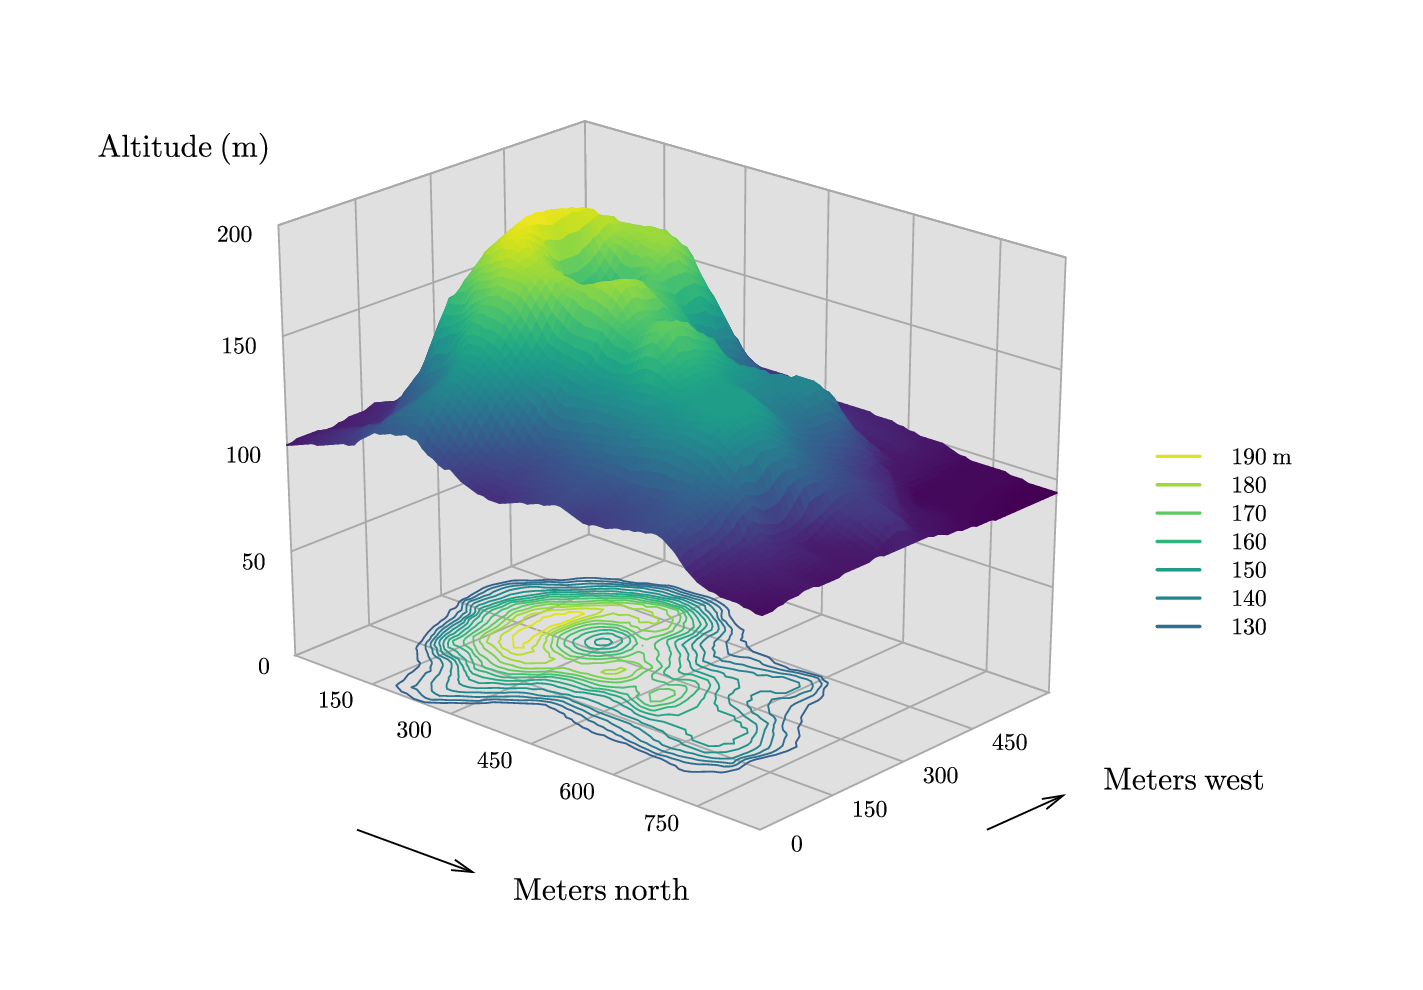
maunga3c.gle
 maunga3c.gle maunga3c.zip zip file contains all files for this figure.
maunga3c.gle
! Example of surface plot with added contours.
! Author: Francois Tonneau

include s3.gle
include palettes.gle

size 18 12.5

xrange 0 860
yrange 0 620
zrange 94 195

zaxisrange 0 200

scaling 1.43 1 1.3

angles 48 26
persp 0.85

viewport 10 9

! Build auxiliary files for contour plotting.

begin contour
    data "maunga3c.z"
    values from 125 to 195 step 5
end contour

! Draw plot panes.

amove 3.5 2

begin origin

set lwidth 0.02 color "#a9a9a9" fill "#e0e0e0"
pane B
grid xB 150 750 150
grid yB 150 450 150
pane I
grid zI 50 200 50
grid xI 150 750 150
pane J
grid yJ 150 450 150
grid zJ 50 200 50

! Add axis labels.

set color black font ss hei 0.3
set just cc
for num = 150 to 750 step 150
    label XB num 0.5 num
next num
set just cc
for num = 0 to 450 step 150
    label YB num 0.5 num
next num
set just cr
for num = 0 to 200 step 50
    label JX num 0.35 num
next num

! Add axis titles and arrows.

set hei 0.4 just cc
amove 4.1 -0.75
write "Meters north "
amove 11.5 0.65
write "Meters west "
amove -1.2 8.65
write "Altitude (m)"

set arrowstyle simple
set arrowsize 0.3
amove 1 0
rline 1.5 -0.55 arrow end
amove 9 0
rline 1 0.45 arrow end

! Define palette for contour lines and surface facets.

sub hue z
    return viridis((z - s3_zmin)/(s3_zmax - s3_zmin))
end sub

! Draw contour lines on the base plane.

s3contourlines maunga3c hue

! Draw volcano surface.

set lwidth 0.02
s3datasurf maunga3c.dat hue same
!               facet --^   ^-- facet borders

! Add color key.

set color black
begin key
    absolute 11 5 just tl nobox dist 0.4 hei 0.3
    line color hue(190) lwidth 0.04 text "190 m"
    for value = 180 to 130 step -10
        line color hue(value) lwidth 0.04 text num$(value)
    next value
end key

end origin
mesh.gle
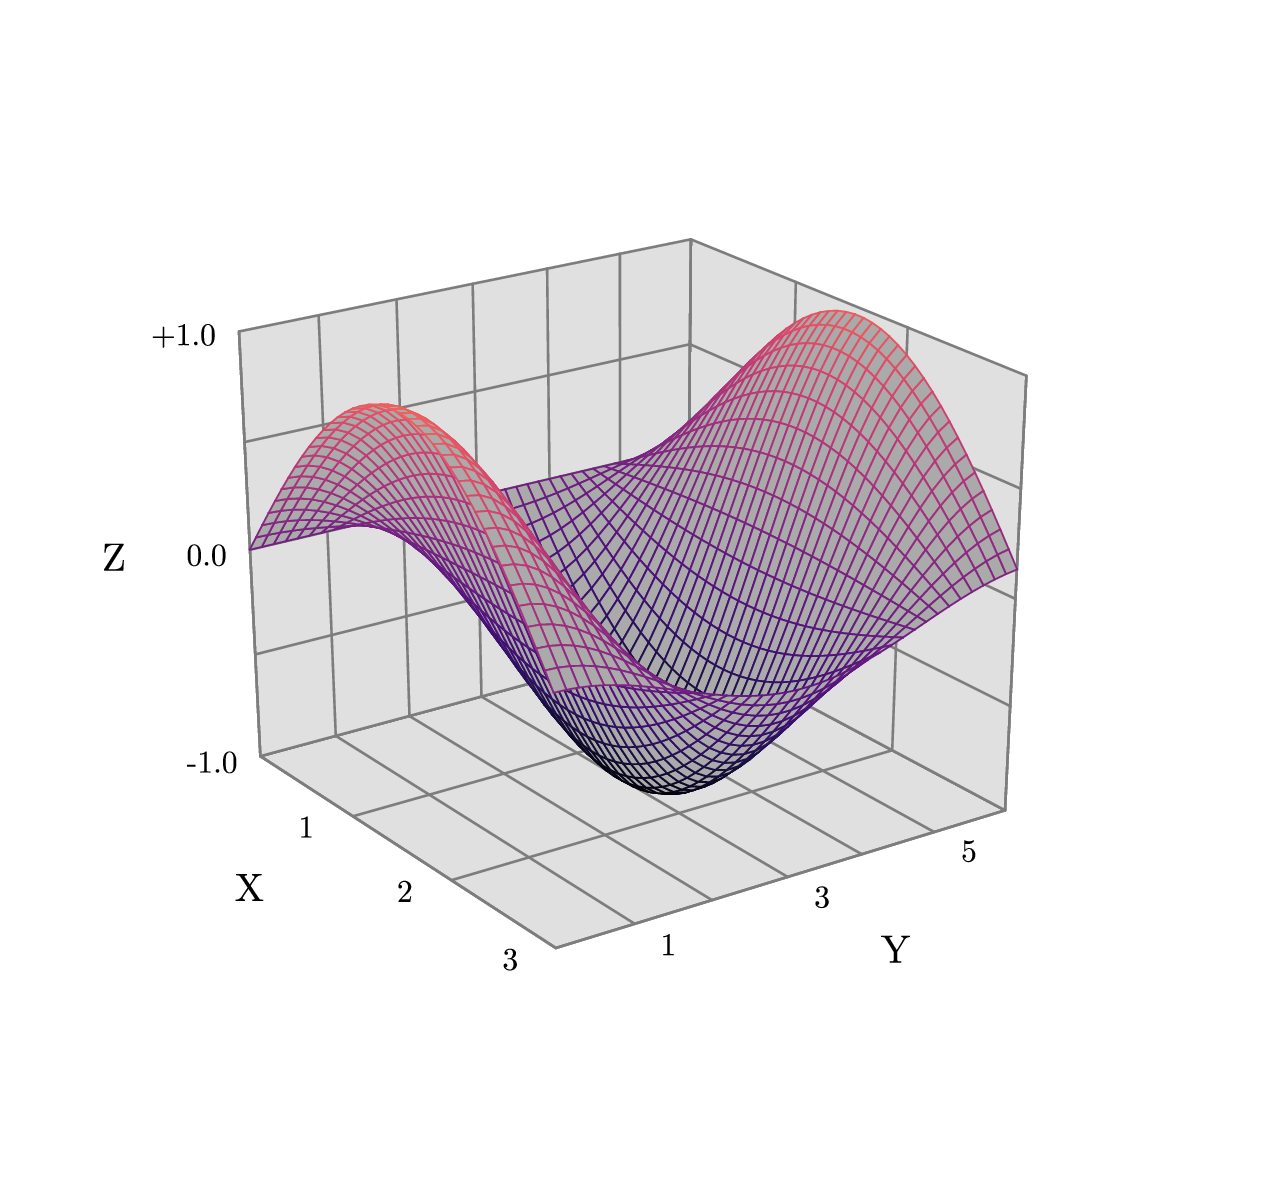
mesh.gle
! Example of mesh plot.
! Author: Francois Tonneau

include s3.gle
include palettes.gle

size 16 15

xrange 0 3
yrange 0 6
zrange -1 1

angles 35 25
persp 0.80

viewport 10 9

amove 3 3

set cap round join round

begin origin

! Draw plot panes.

set lwidth 0.03 color gray40 fill "#e0e0e0"
pane B
grid xB 0 3 1
grid yB 0 6 1
pane I
grid xI  0 3 1
grid zI -0.5 0.5 0.5
pane J
grid yJ  0 6 1
grid zJ -0.5 0.5 0.5

! Add axis labels.

set color black font ss hei 0.4
set just cr
label XB 1 0.5 1
label XB 2 0.5 2
label XB 3 0.5 3
set just cc
label YB 1 0.5 1
label YB 3 0.5 3
label YB 5 0.5 5
set just rc
label JX -1 0.3 "-1.0"
label JX  0 0.3 " 0.0"
label JX  1 0.3 "+1.0"

! Add axis titles.

set hei 0.5
label XB 1.5 1.8 "X"
label YB   3 1.8 "Y"
label JX 0.1 1.6 "Z"

! Proceed to plot.

sub sincos x y
    return sin(x)*cos(y)
end sub

sub fillpalette z
    return "#aaaaaa"
end sub

sub linepalette z
    return magma((z + 1)/3)
end sub

set lwidth 0.02
s3funcsurf sincos fillpalette linepalette 40 40

end origin
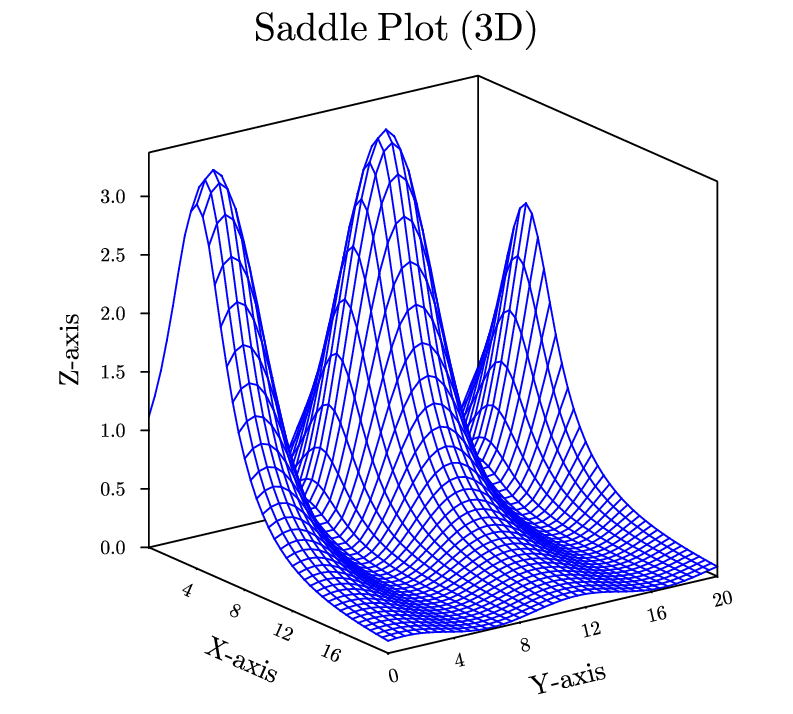
saddle.gle
 saddle.gle saddle.zip zip file contains all files for this figure.
saddle.gle
size 10 9

set font texcmr hei 0.5 just tc

begin letz
   data "saddle.z"
   z = 3/2*(cos(3/5*(y-1))+5/4)/(1+(((x-4)/3)^2))
   x from 0 to 20 step 0.5
   y from 0 to 20 step 0.5
end letz

amove pagewidth()/2 pageheight()-0.1
write "Saddle Plot (3D)"

begin object saddle
   begin surface
      size 10 9
      data "saddle.z"
      xtitle "X-axis" hei 0.35 dist 0.7
      ytitle "Y-axis" hei 0.35 dist 0.7
      ztitle "Z-axis" hei 0.35 dist 0.9
      top color blue
      zaxis ticklen 0.1 min 0 hei 0.25
      xaxis hei 0.25 dticks 4 nolast nofirst
      yaxis hei 0.25 dticks 4
   end surface
end object

amove pagewidth()/2 0.2
draw "saddle.bc"
saddlecol.gle
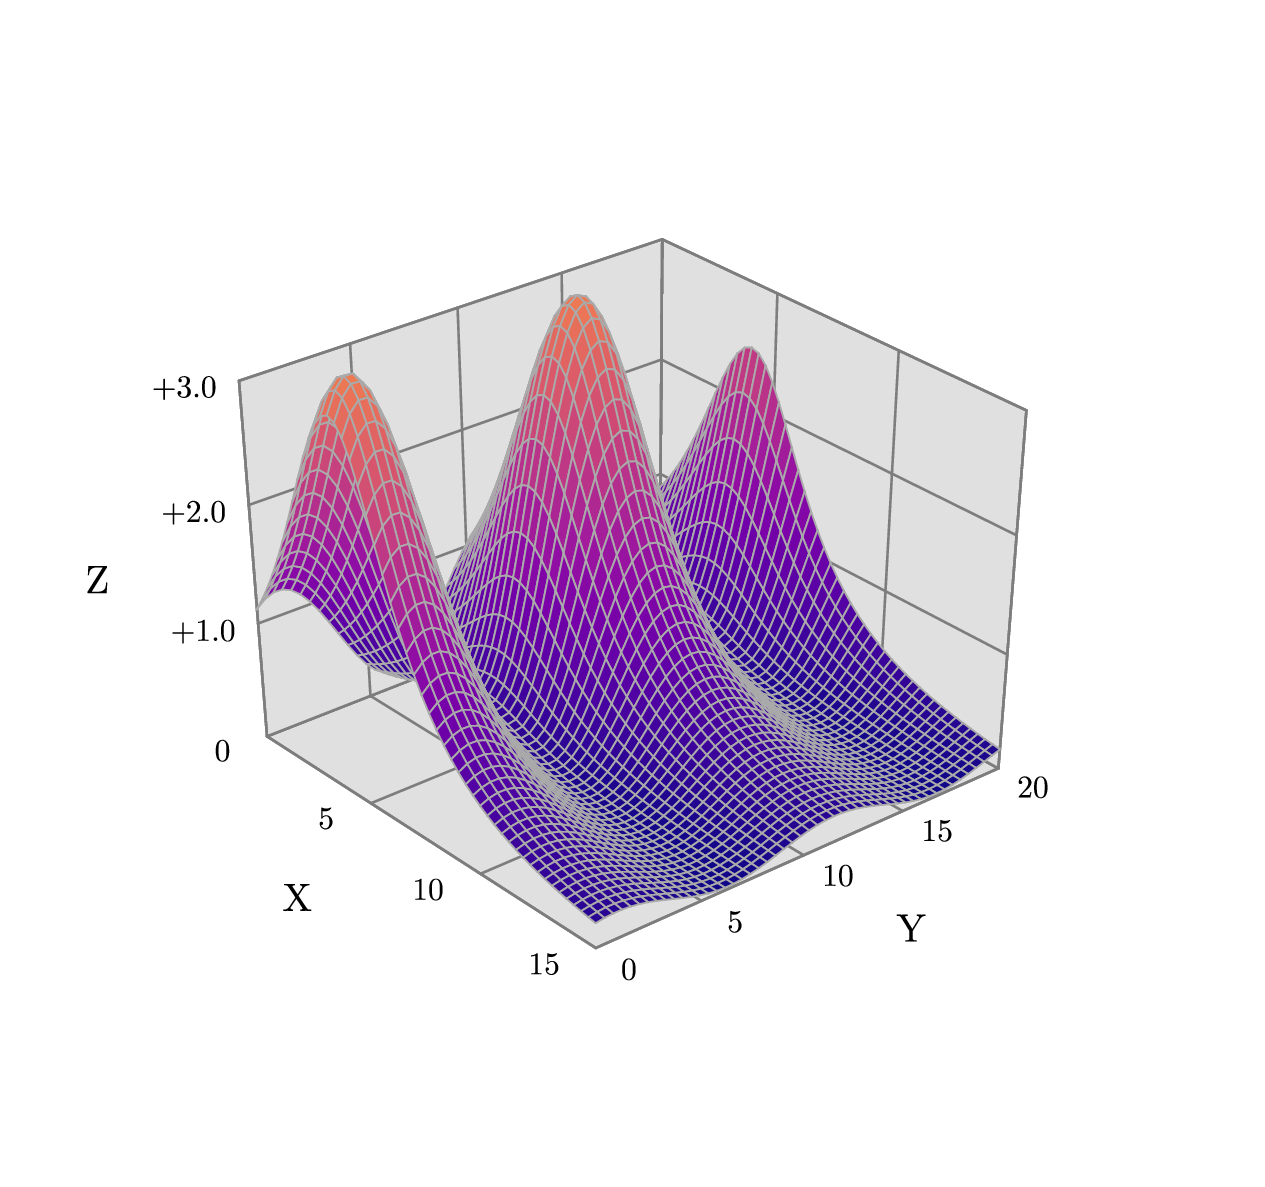
saddlecol.gle
! Colored mesh of saddle function.
! Author: Francois Tonneau

include s3.gle
include palettes.gle

size 16 15

xrange 0 15
yrange 0 20
zrange 0 3

angles 40 35
persp 0.80

viewport 10 9

amove 3 3

set cap round join round

begin origin

! Draw plot panes.

set lwidth 0.03 color gray40 fill "#e0e0e0"
pane B
grid xB 0 15 5
grid yB 0 20 5
pane I
grid xI 0 15 5
grid zI 1 3 1
pane J
grid yJ 0 20 5
grid zJ 1 3 1

! Add axis labels.

set color black font ss hei 0.4
set just cr
label XB 0 0.5 0
label XB 5 0.5 5
label XB 10 0.5 10
label XB 15 0.5 15

set just cc
label YB 0 0.5 0
label YB 5 0.5 5
label YB 10 0.5 10
label YB 15 0.5 15
label YB 20 0.5 20
set just rc
label JX  1 0.3 "+1.0"
label JX  2 0.3 "+2.0"
label JX  3 0.3 "+3.0"

! Add axis titles.

set hei 0.5
label XB 8   1.7 "X"
label YB 10  1.8 "Y"
label JX 1.8 1.9 "Z"

! Proceed to plot.

sub sincos x y
    return sin(x)*cos(y)
end sub

sub saddle x y
    return 3/2 * (cos(3/5*(y-1))+5/4)/(1+(((x-4)/3)^2))
end sub

sub fillpalette z
    return plasma(z / 5)
end sub

sub linepalette z
    return "#aaaaaa"
end sub

set lwidth 0.02
s3funcsurf saddle fillpalette linepalette 50 50

end origin
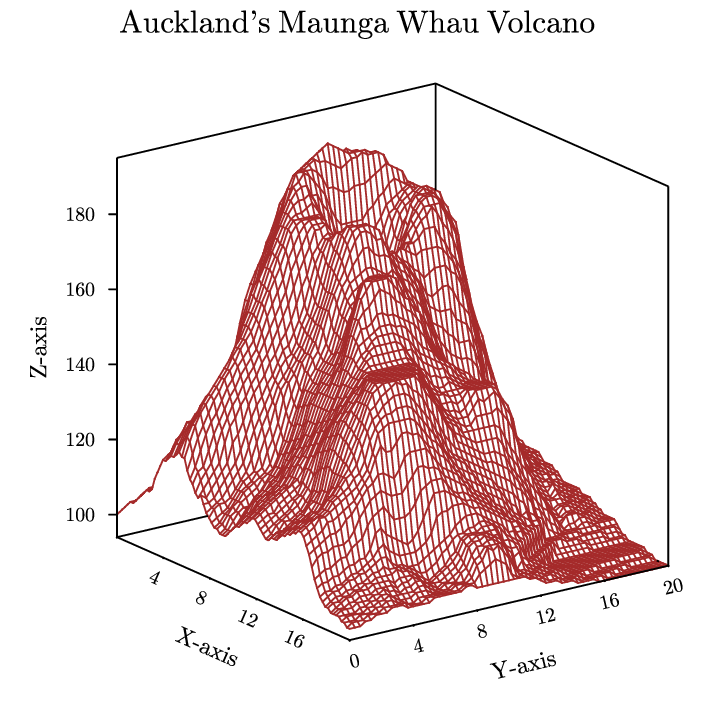
volcano3d.gle
 volcano3d.gle volcano3d.zip zip file contains all files for this figure.
volcano3d.gle
size 9 9

set font texcmr hei 0.4 just tc
amove pagewidth()/2 pageheight()-0.1
write "Auckland's Maunga Whau Volcano"

begin object volcano
   begin surface
      size 9 9
      data "volcano.z"
      xtitle "X-axis" hei 0.3 dist 0.7
      ytitle "Y-axis" hei 0.3 dist 0.7
      ztitle "Z-axis" hei 0.3 dist 0.9
      top color brown
      zcolour brown
      zaxis ticklen 0.1 hei 0.25
      xaxis hei 0.25 dticks 4 nolast nofirst
      yaxis hei 0.25 dticks 4
   end surface
end object

amove pagewidth()/2 0.4
draw "volcano.bc"