
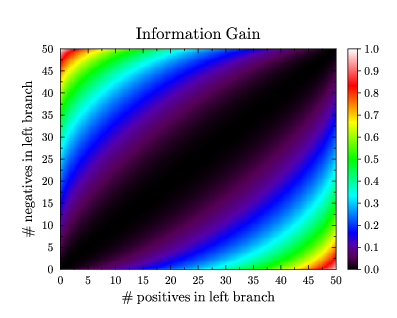
GLE Example: informationgain.gle
[PDF file]
size 10 8

include "color.gle"

set font texcmr

tpos = 50; tneg = 50
tot = tpos + tneg

sub entropy p
   if (p = 0) or (p = 1) then return 0
   else return -p*log(p)/log(2) - (1-p)*log(1-p)/log(2)
end sub

sub information_gain lpos lneg
   local rpos = tpos - lpos
   local rneg = tneg - lneg
   local ltot = lpos + lneg
   local rtot = rpos + rneg
   return entropy(tpos/tot) - &
      ltot/tot*entropy(sdiv(lpos,ltot)) - rtot/tot*entropy(sdiv(rpos,rtot))
end sub

begin graph
   xaxis min 0 max tpos
   yaxis min 0 max tneg
   title "Information Gain"
   xtitle "# positives in left branch"
   ytitle "# negatives in left branch"
   colormap information_gain(x,y) 250 250 color
end graph

set hei 0.29
amove xg(xgmax)+0.3 yg(ygmin)
color_range_vertical zmin 0 zmax 1 zstep 0.1 pixels 500 format "fix 1"
[Return to examples page]