
GLE Example: let-multi-dim.gle
[PDF file]
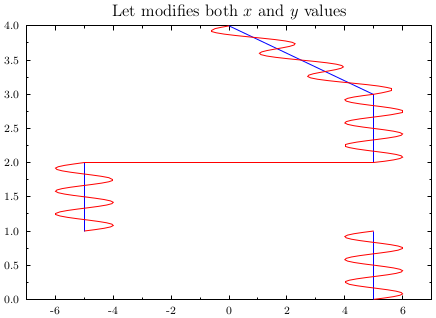
size 11 8

set texlabels 1
begin graph
   scale auto
   title "Let modifies both $x$ and $y$ values"
   xaxis min -7 max 7
   yaxis min 0 max 4
   data "let-multi-dim.csv"
   let d2 = d1, x
   let d3 = d1+sin(6*pi*x), x from 0 step 0.02
   d2 line color blue
   d3 line color red
end graph
[Return to examples page]