
GLE Example: fitls.gle
[PDF file]
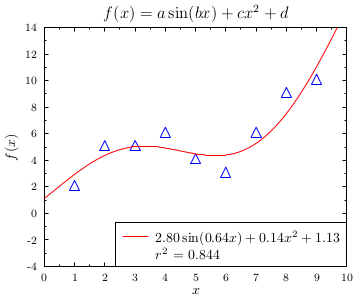
size 9 7.5

a = 0; b = 0; c = 0; d = 0; r = 0

set texlabels 1
begin graph
   scale  auto
   xtitle "$x$"
   ytitle "$f(x)$"
   title  "$f(x) = a\sin(bx)+cx^2+d$"
   xaxis min 0  max 10
   yaxis min -4 max 14
   data   "fitls.dat"
   let d2 = fit d1 with a*sin(b*x)+c*x^2+d rsq r
   d1 marker triangle color blue
   d2 line color red
end graph

fct$ = "$"+format$(a,"fix 2")+"\sin("+format$(b,"fix 2")+"x)+"+&
       format$(c,"fix 2")+"x^2+"+format$(d,"fix 2")+"$"

begin key
   pos br
   line color red text fct$
   text "$r^2$ = "+format$(r,"fix 3")
end key
[Return to examples page]